Stock Fundamentals API
A US company files a 10-K with "Revenue" on line 4. A German company files under IFRS and calls it "Turnover" on line 12. A Japanese company translates its filing and labels it "Net sales." The concept is the same. The label, the currency, the line-item granularity are all different. If you want to compare Apple's margins to SAP's, you need someone to normalize those filings into the same schema first.
That is what SavaNet does. viaNexus serves SavaNet's normalized fundamentals through a single REST endpoint. One API call returns income statement, balance sheet, and cash flow fields in a single record, with the same field names regardless of where the company is listed or what accounting standard it follows.
A real response
Pull Apple's most recent quarterly filing:
GET /v1/data/edge/normalized_fundamentals/AAPL-US/quarterly?token=YOUR_TOKEN&last=1{
"symbol": "AAPL-US",
"reportType": "quarterly",
"fiscalDate": "2026-09-30",
"filingType": "10-Q",
"netRevenue": 94930000000,
"costOfRevenue": 52560000000,
"grossProfit": 42370000000,
"operatingIncome": 29560000000,
"netIncome": 24850000000,
"totalAssets": 364980000000,
"totalLiabilities": 290830000000,
"shareholdersEquity": 74150000000,
"cashAndEquivalents": 29960000000,
"operatingCashFlow": 26810000000,
"capitalExpenditures": -2930000000,
"freeCashFlow": 23880000000,
...
}All three statements in one record. netRevenue is called netRevenue whether you pull AAPL-US, SAP-GY, or 7203-JP. You write one parser.
What normalization actually does
| Raw filing | Label in filing | After SavaNet |
|---|---|---|
| Apple 10-Q (US GAAP) | Net sales | netRevenue |
| SAP Annual Report (IFRS) | Total revenue | netRevenue |
| Toyota Securities Report | Net revenues (translated) | netRevenue |
SavaNet reads the original filing, maps each line item to a standard taxonomy (IFRICS), converts currencies where needed, and outputs a record with uniform field names. That mapping is the hard part. "Operating income" in a US 10-K includes different items than "operating profit" in an IFRS filing. SavaNet reconciles those differences so you do not have to.
Report types
The second path parameter selects the period:
| reportType | What it returns |
|---|---|
quarterly |
Single quarter (10-Q or equivalent) |
annual |
Full fiscal year (10-K or equivalent) |
L4Q |
Trailing four quarters (last twelve months) |
The dataset is always edge/normalized_fundamentals/{symbol}/{reportType}. Swap the last segment and you switch periods. Add &last=8 to get the last 8 filings for trend analysis.
What is in a record
Each record contains fields from all three financial statements:
Income statement: netRevenue, costOfRevenue, grossProfit, operatingIncome, netIncome, earningsPerShare, dilutedEPS, and dozens of intermediate line items.
Balance sheet: totalAssets, totalLiabilities, shareholdersEquity, cashAndEquivalents, shortTermDebt, longTermDebt, totalDebt.
Cash flow: operatingCashFlow, capitalExpenditures, freeCashFlow, dividendsPaid, shareRepurchases.
You do not need to join three separate datasets. One call, one record, all three statements.
Derived stats and ratios
Beyond the raw statements, viaNexus also computes and serves derived metrics: P/E ratios, market capitalization, moving averages, RSI-14, and other commonly used statistics. These sit in the CORE workspace and update as new filings come in. If you only need the ratios, pull those directly. If you need the underlying numbers, pull the fundamentals and compute your own.
Estimates and actuals
The ESTIMATES workspace includes consensus earnings estimates, revenue estimates, and revision history. TrueBeats measures whether a company's actual results exceeded the real consensus (not just the published number, which can be stale by the time earnings hit). Pull the estimate before the print, pull the actual after, compare. Same symbol format, same API pattern.
Using fundamentals in an AI agent
Connect viaNexus to Claude through the MCP server and ask "show me Apple's revenue growth over the last 4 quarters." The agent calls search to find the fundamentals dataset, calls fetch with last=4, does the math, and answers. It can also pull the earnings calendar, price history, and news in the same conversation, since those are all separate datasets on the same connection.
Setup: search for viaNexus in the Claude integrations directory and click Connect. Full details on the AI agent connection.
Coverage
SavaNet covers thousands of publicly traded companies across major global markets. US coverage (NYSE, NASDAQ, NYSE American) is the deepest. European markets (London, XETRA, Euronext, Madrid) and Asian markets (Tokyo, Hong Kong, Singapore) are also covered. Symbol format is ticker plus exchange suffix: AAPL-US, SAP-GY, VOD-LN, 7203-JP. Browse available symbols in the data catalog.
See it live
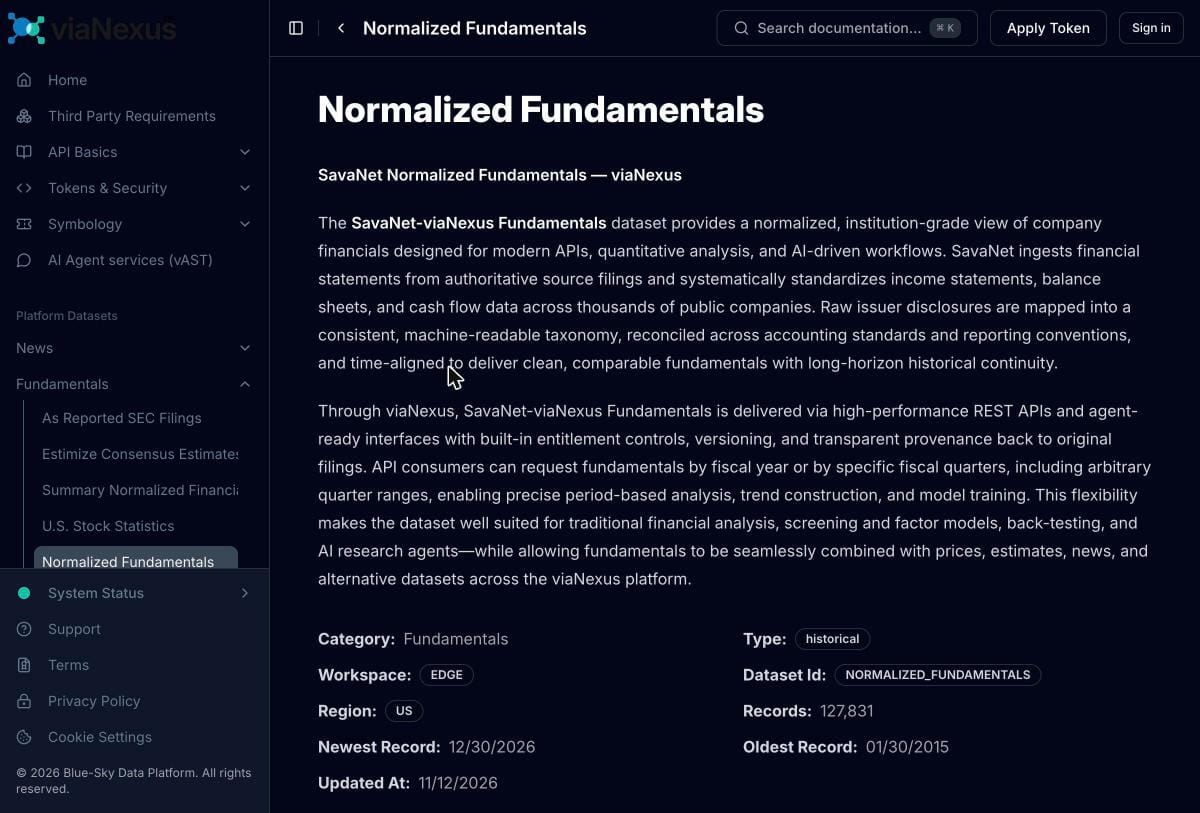
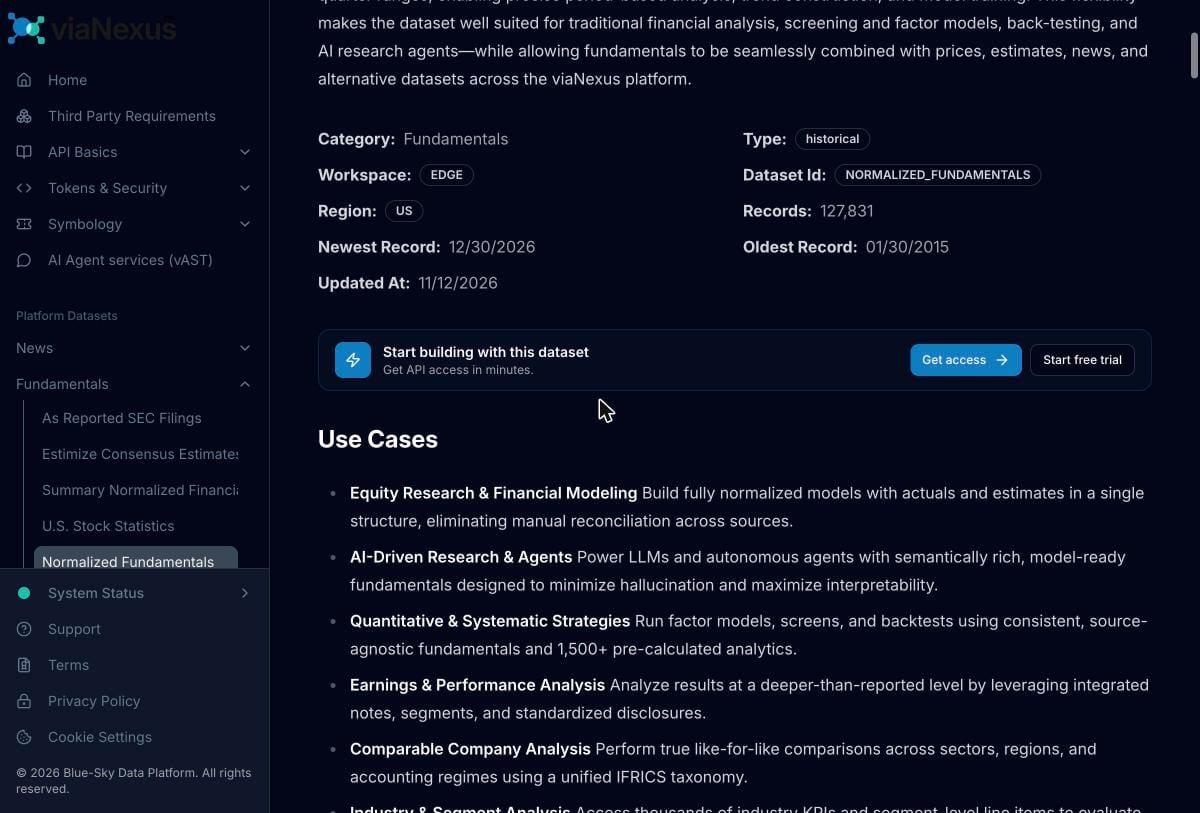
Ask Claude directly: Connect viaNexus through the Claude integrations directory and ask "show me Apple's revenue and net income for the last 4 quarters." The agent calls the normalized_fundamentals dataset, gets the numbers, and does the comparison, all in one conversation.
Explore the schema: The data catalog lists every field in the fundamentals dataset, its type, and what it maps to. If you want to see the full record structure before you write code, start there.
Start here
Create a free account (14-day trial, no credit card). The trial unlocks every dataset, so you can test fundamentals alongside prices, news, and estimates before choosing a plan. Pricing is in the catalog.
Related
- Earnings Calendar API — know when the next print drops, confirmed from the SEC filing.
- Market Data API — end-of-day prices, corporate actions, and dividends across global exchanges.
- Financial Data for AI Agents — how Claude and Cursor pull fundamentals during a conversation.
- MCP Server Guide — connection setup and the full tool reference.