Think about what goes into a stock page. The kind your users open a hundred times a day and never think about.
It needs a live price that actually moves. A chart that works at one day and at five years. The statistics people check before they act: market cap, P/E, moving averages, the 52-week range. Dividend history, because income investors ask. The next earnings date, because everyone asks. And the headlines that explain why the number moved.
Building that has traditionally meant a vendor for real-time quotes, another for historical bars, a third for fundamentals and corporate actions, and a news provider on top. Four contracts, four schemas, four sets of quirks, and a normalization layer you own forever.
Last week one of our engineers had a working version on screen in fifteen minutes, using eight viaNexus datasets and a connector that plugs straight into the editor he was already working in.
Start With the Connector
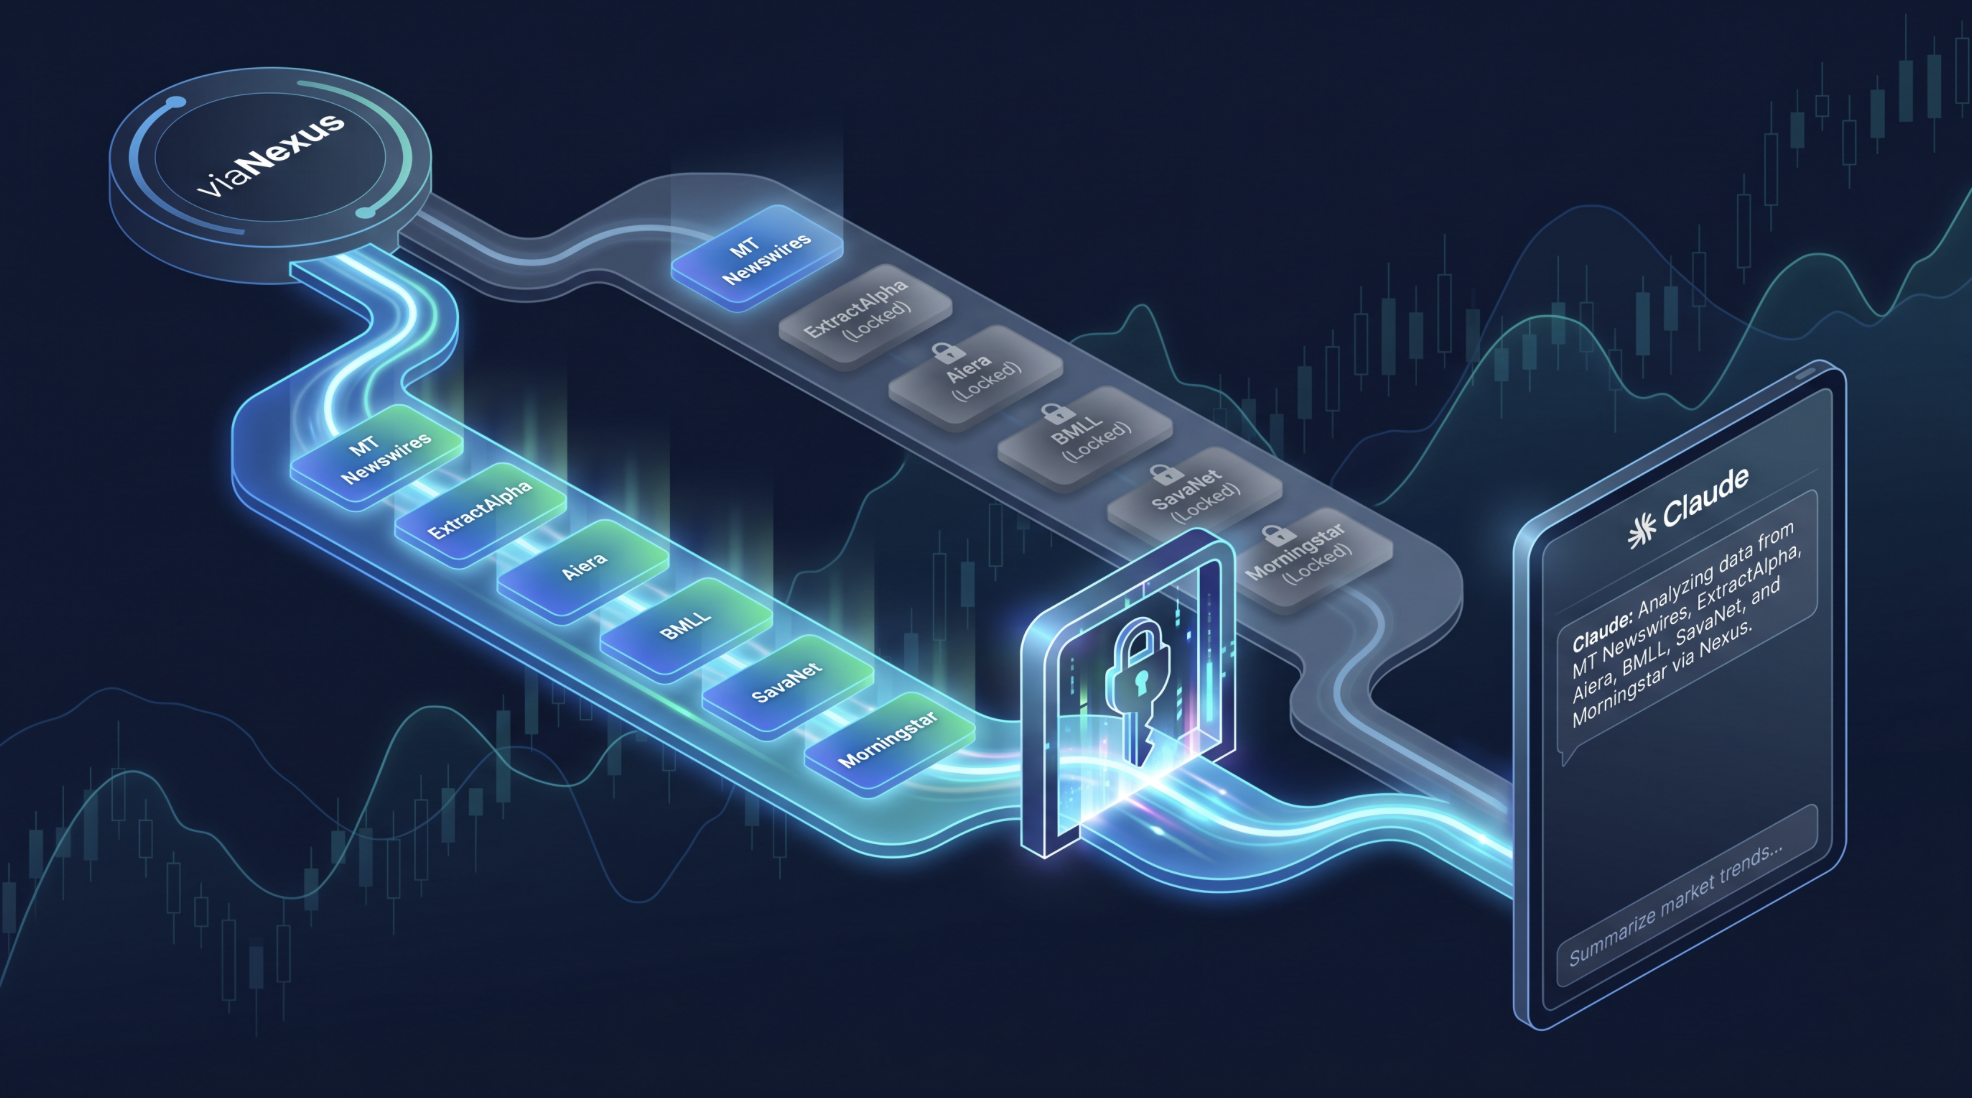
The viaNexus MCP connector is now officially available in Cursor and in Claude. Add it once and your editor can query our datasets while it writes your code.
That changes how the code gets written. The assistant is not reading about our API, it is calling it, checking real responses and real field names as it goes. Wrong guesses get caught before they reach your file.
The endpoint is https://vast.blueskyapi.com/vianexus/mcp, authenticated with the same key as the REST API. One click from either directory listing and your editor has live market data.
What Actually Happened
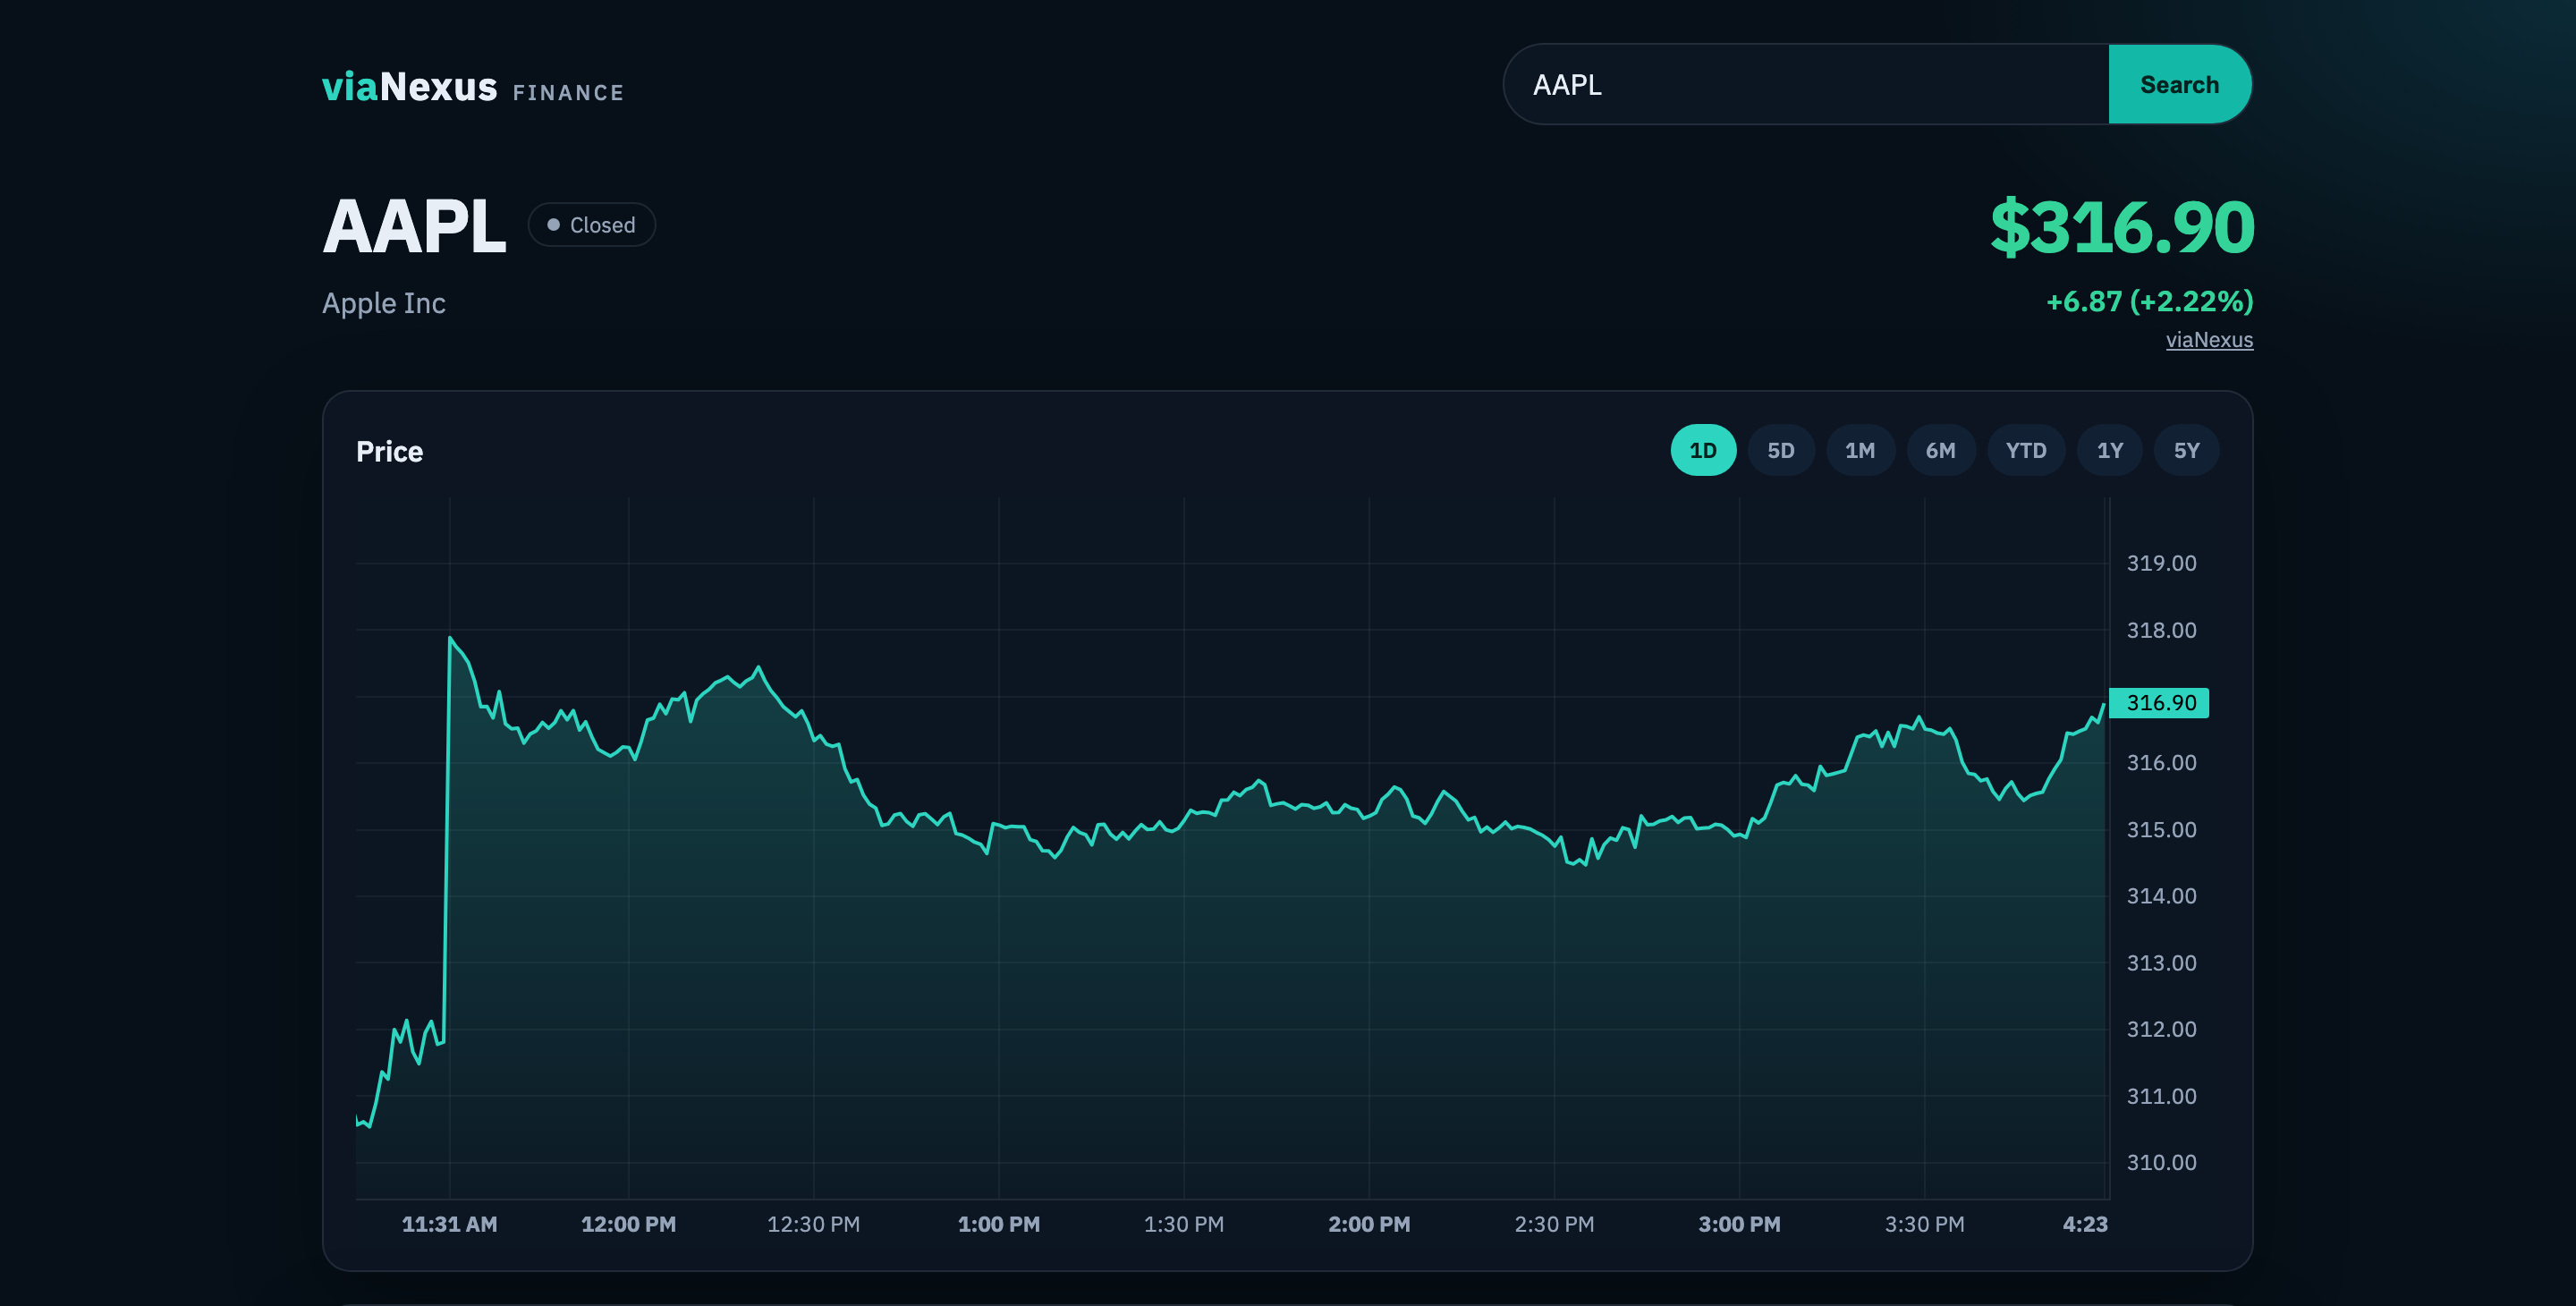
Kai Gong, a developer at viaNexus, opened an AI coding assistant, pointed it at our documentation, and asked for a stock quote page.
Fifteen minutes later there was a page with a live, ticking price. By the thirty minute mark every panel was in: charts, statistics, dividends, earnings, news. Styling took another thirty to forty-five minutes, which is the only part that needed a human with opinions.
The assistant had never seen our API. It read the docs, worked out which datasets it needed, and wrote correct calls on the first pass. If a model can get from your documentation to working code with nobody translating in between, your developers can do it faster still.
The Calls Behind the Screen
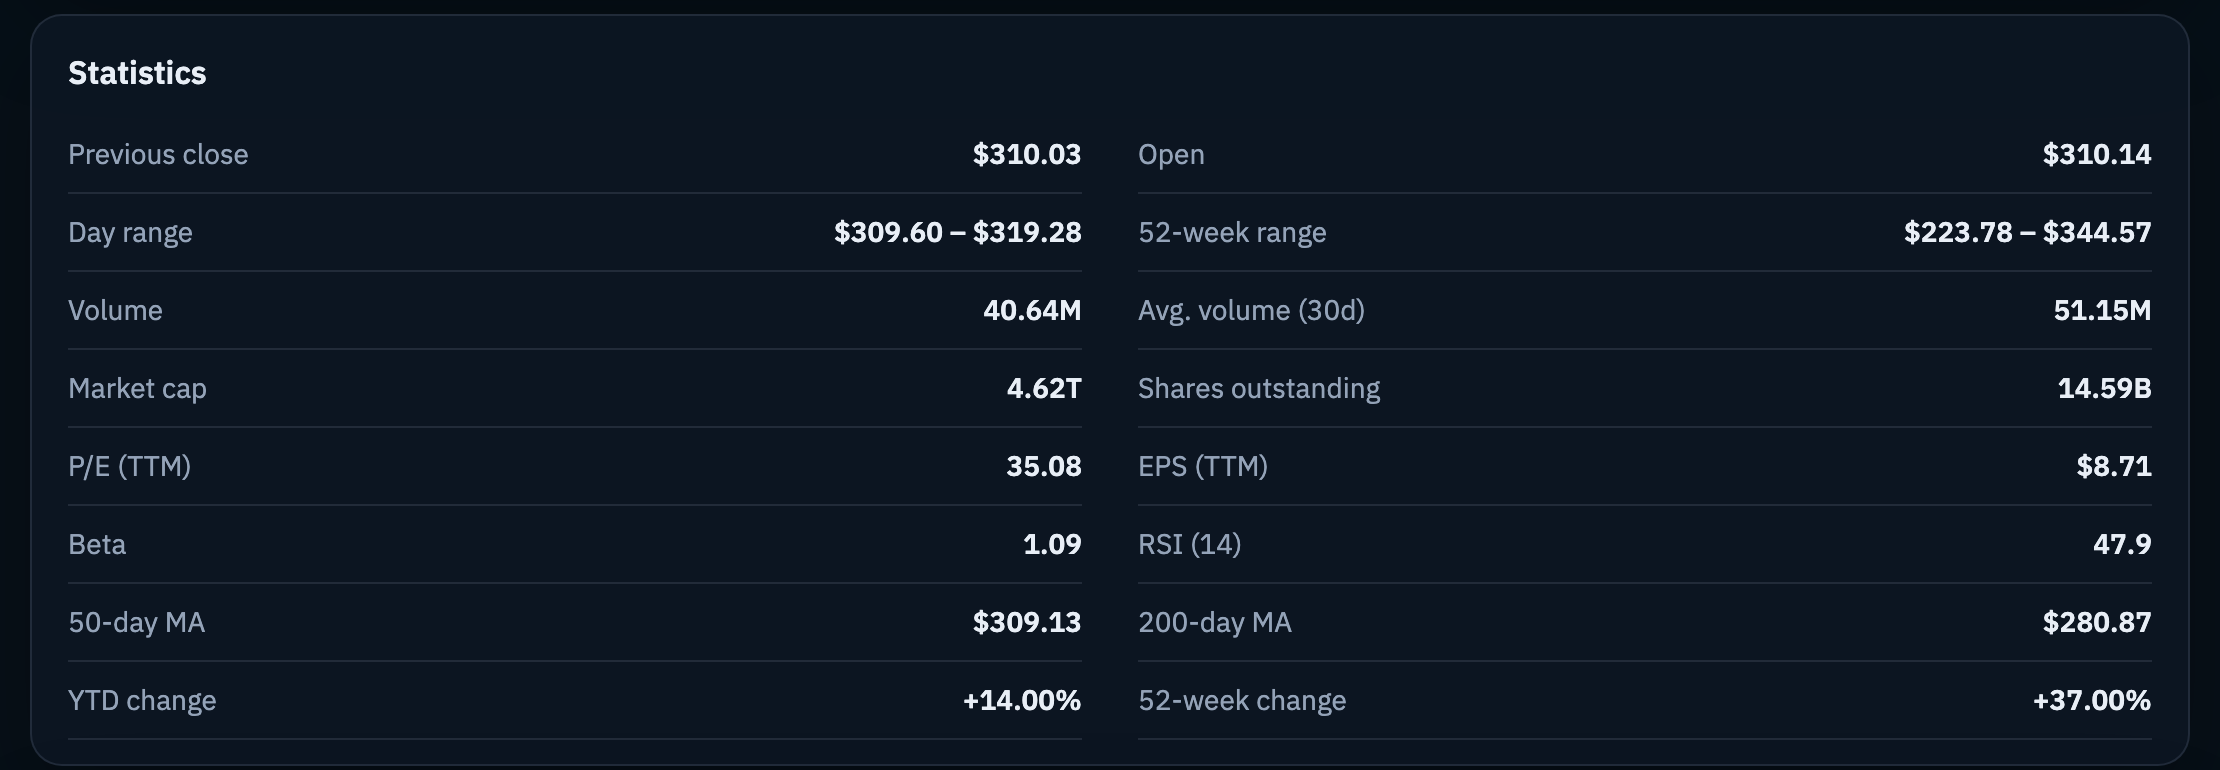
The statistics grid is a single request. Not a rolling window you maintain, not a history you fetch and reduce. One row, already calculated:
GET /v1/data/CORE/STOCK_STATS_US/AAPL?last=1That returns RSI, beta, 50 and 200 day moving averages, the 52-week range and change, average volume, shares outstanding, trailing P/E and EPS. Eleven of the sixteen cells on screen come from that one response. Four more come off the quote. Exactly one is calculated, and only because it moves with the live price: market cap is shares outstanding times the last trade.
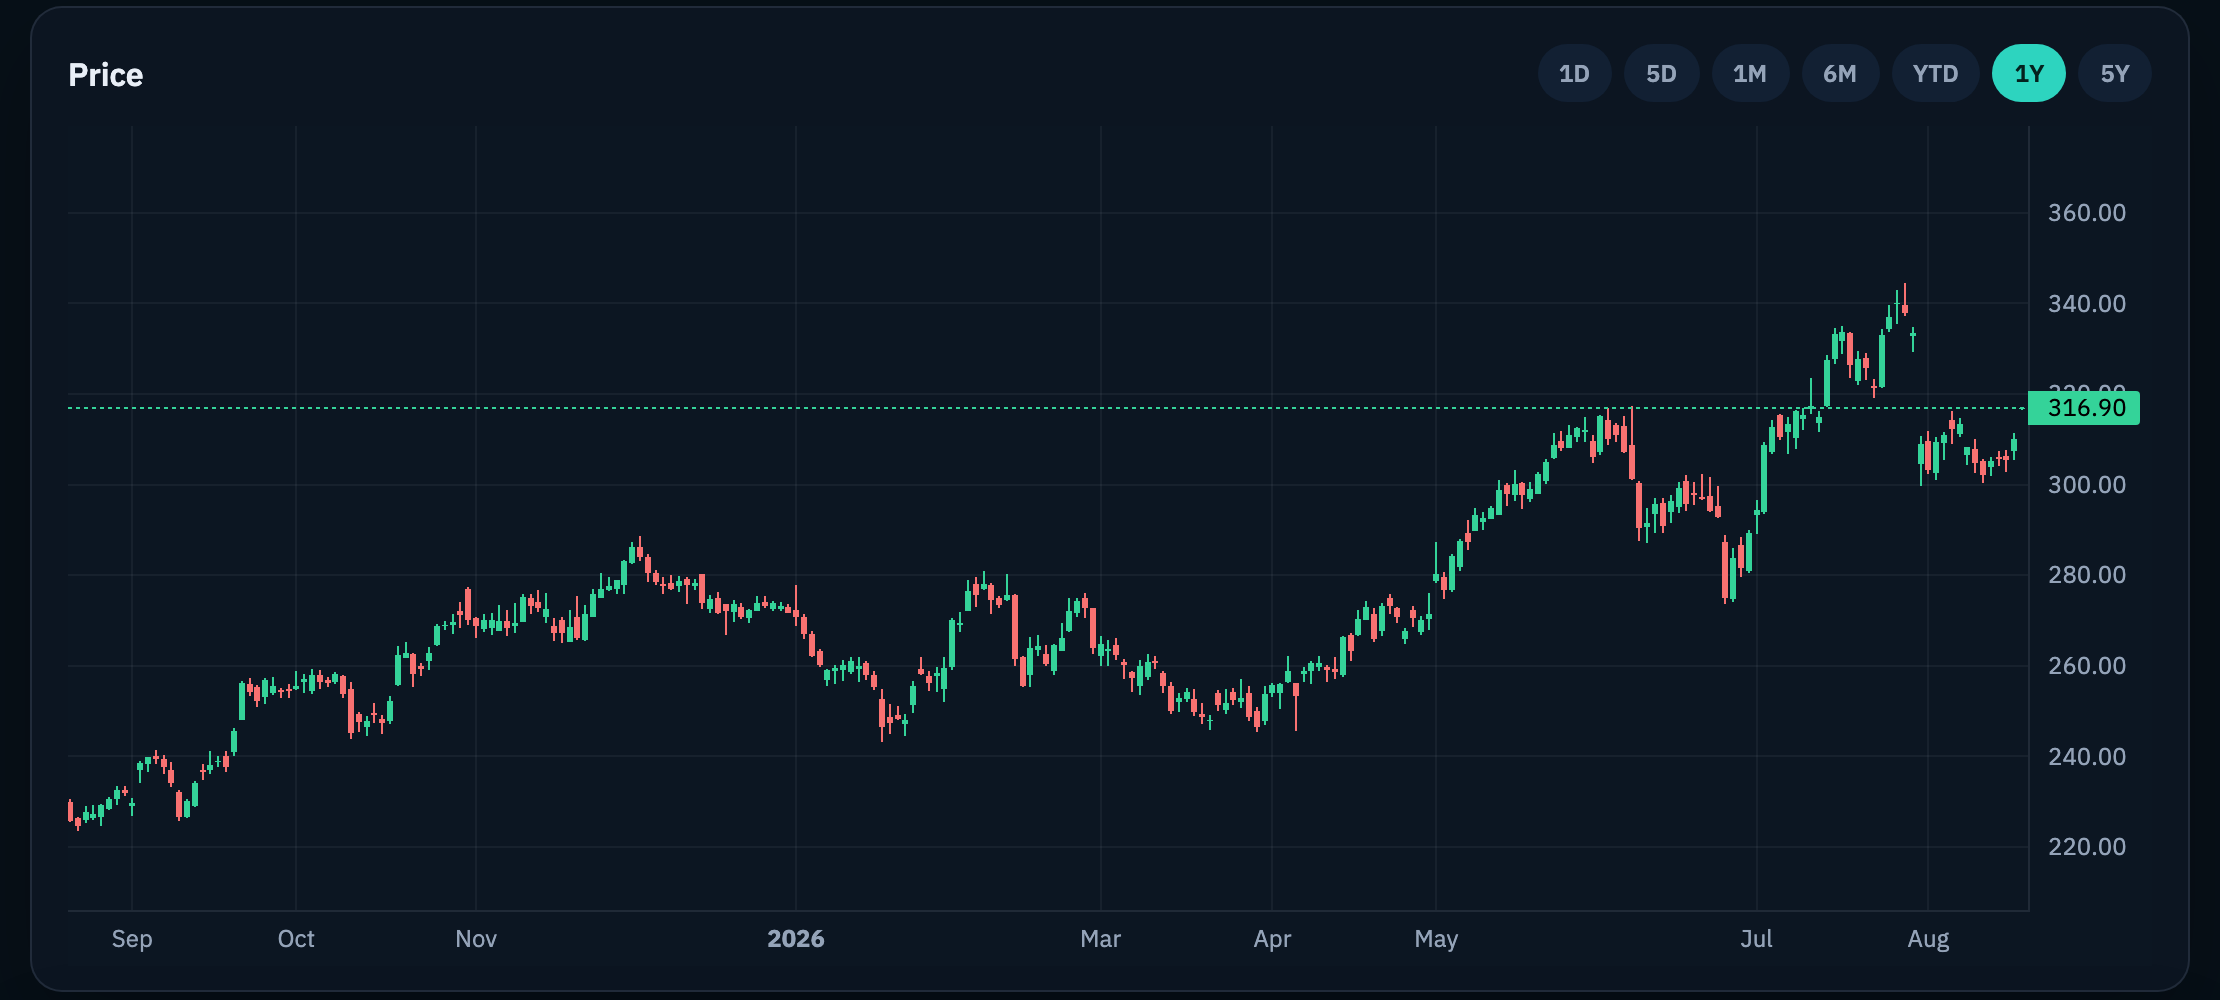
The chart is one call per range, and the range is a parameter:
GET /v1/data/EDGE/HISTORICAL_PRICES/AAPL?range=1y&sort=ASCSplit-adjusted open, high, low and close. Switch to 1D or 5D and the page swaps to intraday bars with the same shape, so the chart code does not change.
The live price is a websocket rather than a poll, so the number on screen moves with the market instead of waiting on a timer:
wss://api.blueskyapi.com/v1/data/CORE/QUOTE/AAPLDividends and news are where teams usually lose a week.
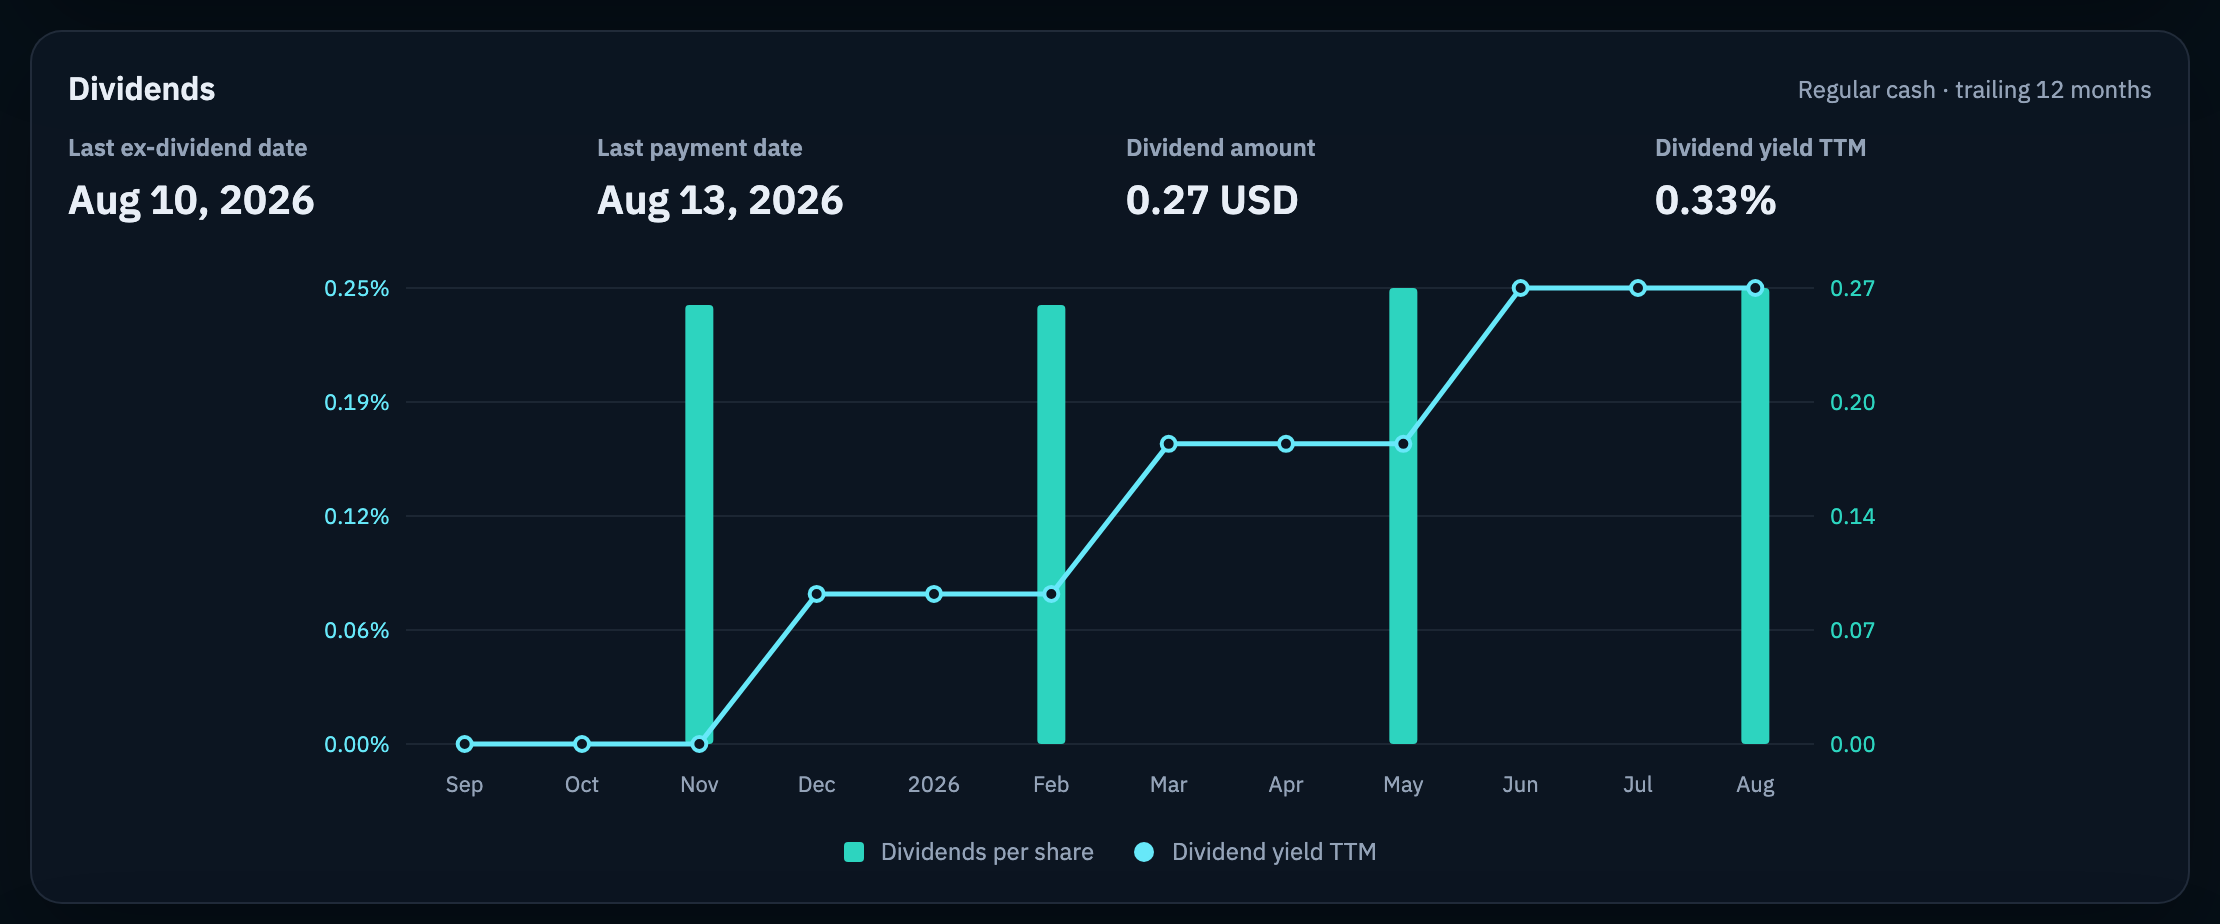
Pull two years of dividends for Costco and you get the regular quarterly payment plus the $15 special it paid in December 2023. Add that column up and the yield you put on screen is nonsense. The same feed carries supplementary payments, frequencies marked irregular, and rows with an amount of zero. Every row tells you which is which, because marker, frequency and status are populated on all of them. Filtering down to the recurring cash stream is a few lines, not a research project.
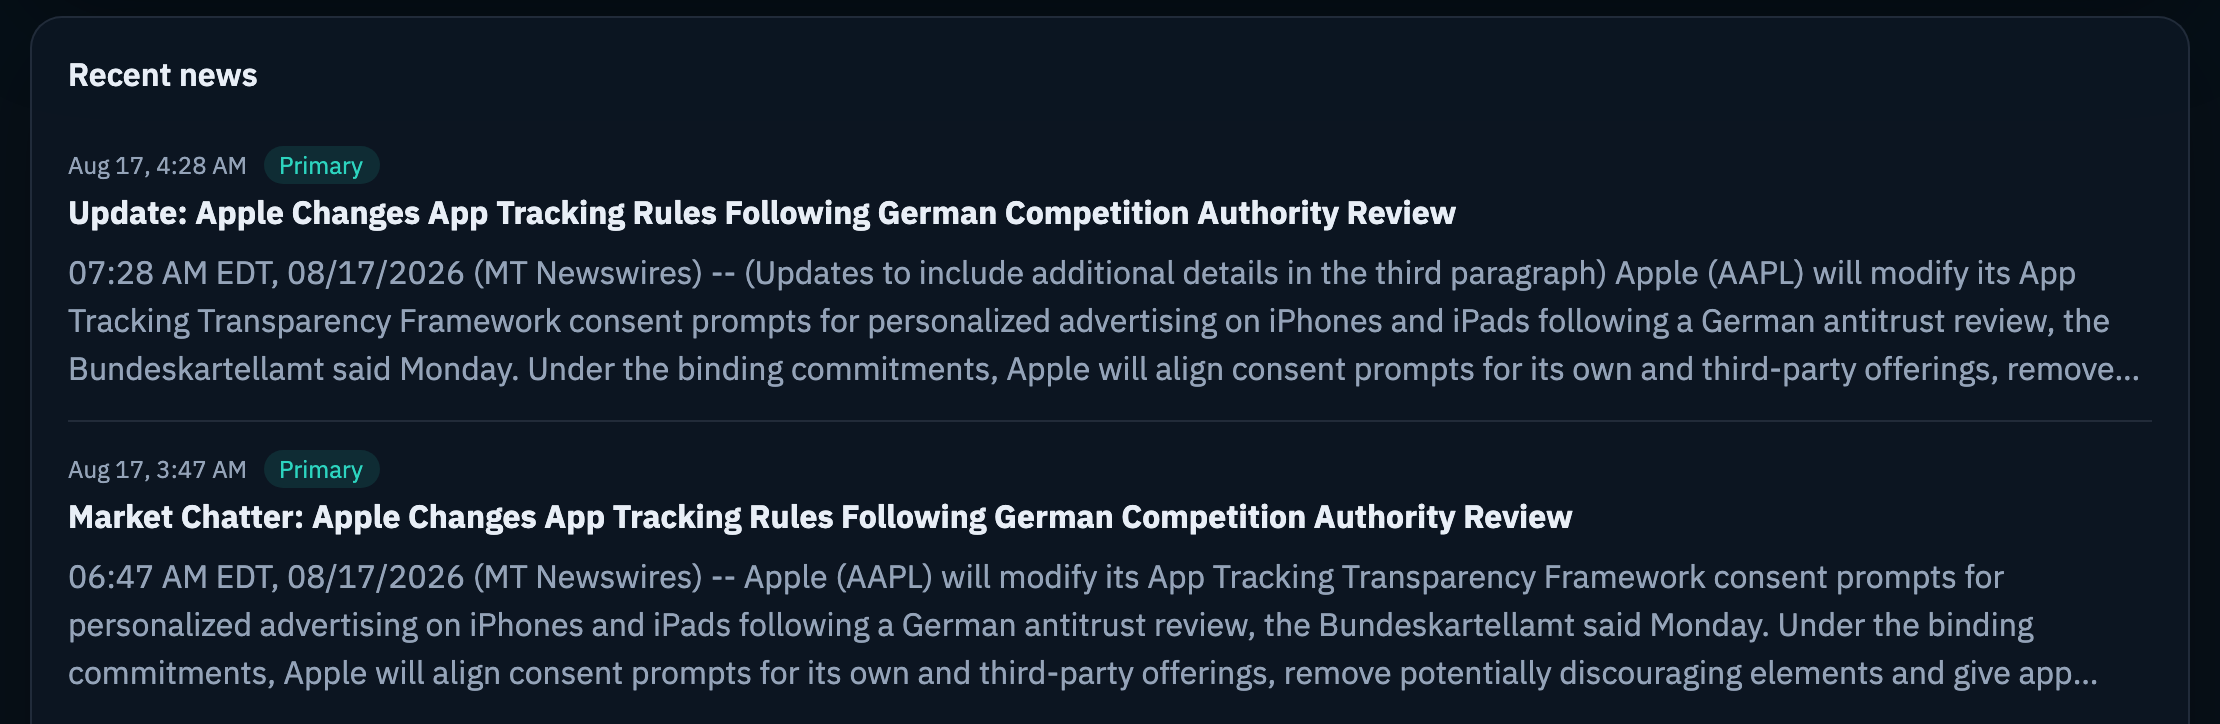
News has the same problem wearing a different hat. Ask for Apple's headlines and you also get "Sector Update: Tech Stocks Rise Late Afternoon" and "Google, Peacock, Apple Convince Maryland Court to Strike Down Ad Tax." Apple is in those stories. They are not about Apple. Every row carries isPrimary, so you decide whether to show that second kind or bury it, and storyType tells you whether it broke during the session or after hours.
Add the earnings calendar and the opening tick and that is the full inventory. Every link goes straight to that dataset's documentation, schema and example calls:
| On screen | viaNexus dataset (click for docs) |
|---|---|
| Live price and chart motion | CORE/QUOTEReal-time quote, streamed over websocket |
| Fallback price | EDGE/VNX_QUOTEviaNexus model-derived price, used when the stream is quiet |
| 1D and 5D charts | CORE/INTRADAY_PRICES1-minute intraday bars |
| 1M to 5Y charts | EDGE/HISTORICAL_PRICESGlobal end-of-day, split adjusted |
| Statistics grid | CORE/STOCK_STATS_USRSI, beta, moving averages, P/E, EPS |
| Dividend history and yield | EDGE/ADVANCED_DIVIDENDSCash and stock dividend events |
| Next earnings alert | CORE/EARNINGS_CALENDARConfirmed and predicted earnings dates |
| News feed | EDGE/MT_NEWSWIRES_North_AmericaReal-time U.S. and Canadian market news |
Same host, same key, same response shape. There is no reconciliation step because there is nothing to reconcile: the symbol that returns a quote returns the dividend history under the same identifier. That is where the fifteen minutes came from.
Now Do Something With It
A quote page is a browser tab. Stop thinking about one symbol at a time and the same eight datasets turn into something you can charge for.
Pass a list instead of a symbol. CORE/QUOTE takes AAPL,MSFT,NVDA and hands back a row for each. That one change turns the page into a watchlist, and a watchlist plus a login is a portfolio monitor. No new endpoint, no new contract.
Let the data tell your users when to look. Our rules engine sits on top of the statistics dataset and fires when a number moves past a line you drew: RSI clears seventy, the 50-day crosses the 200-day, a symbol comes within a percent of its 52-week high. Your users stop refreshing a screen and start getting told when something happened.
Put an agent in front of it. With the connector installed, an assistant can answer "why is NVDA down today" by reading the same licensed newswire your page renders, rather than whatever it found on the open web. That is the difference between a demo and something you would let a customer use.
Stack those and you have stopped building a dashboard:
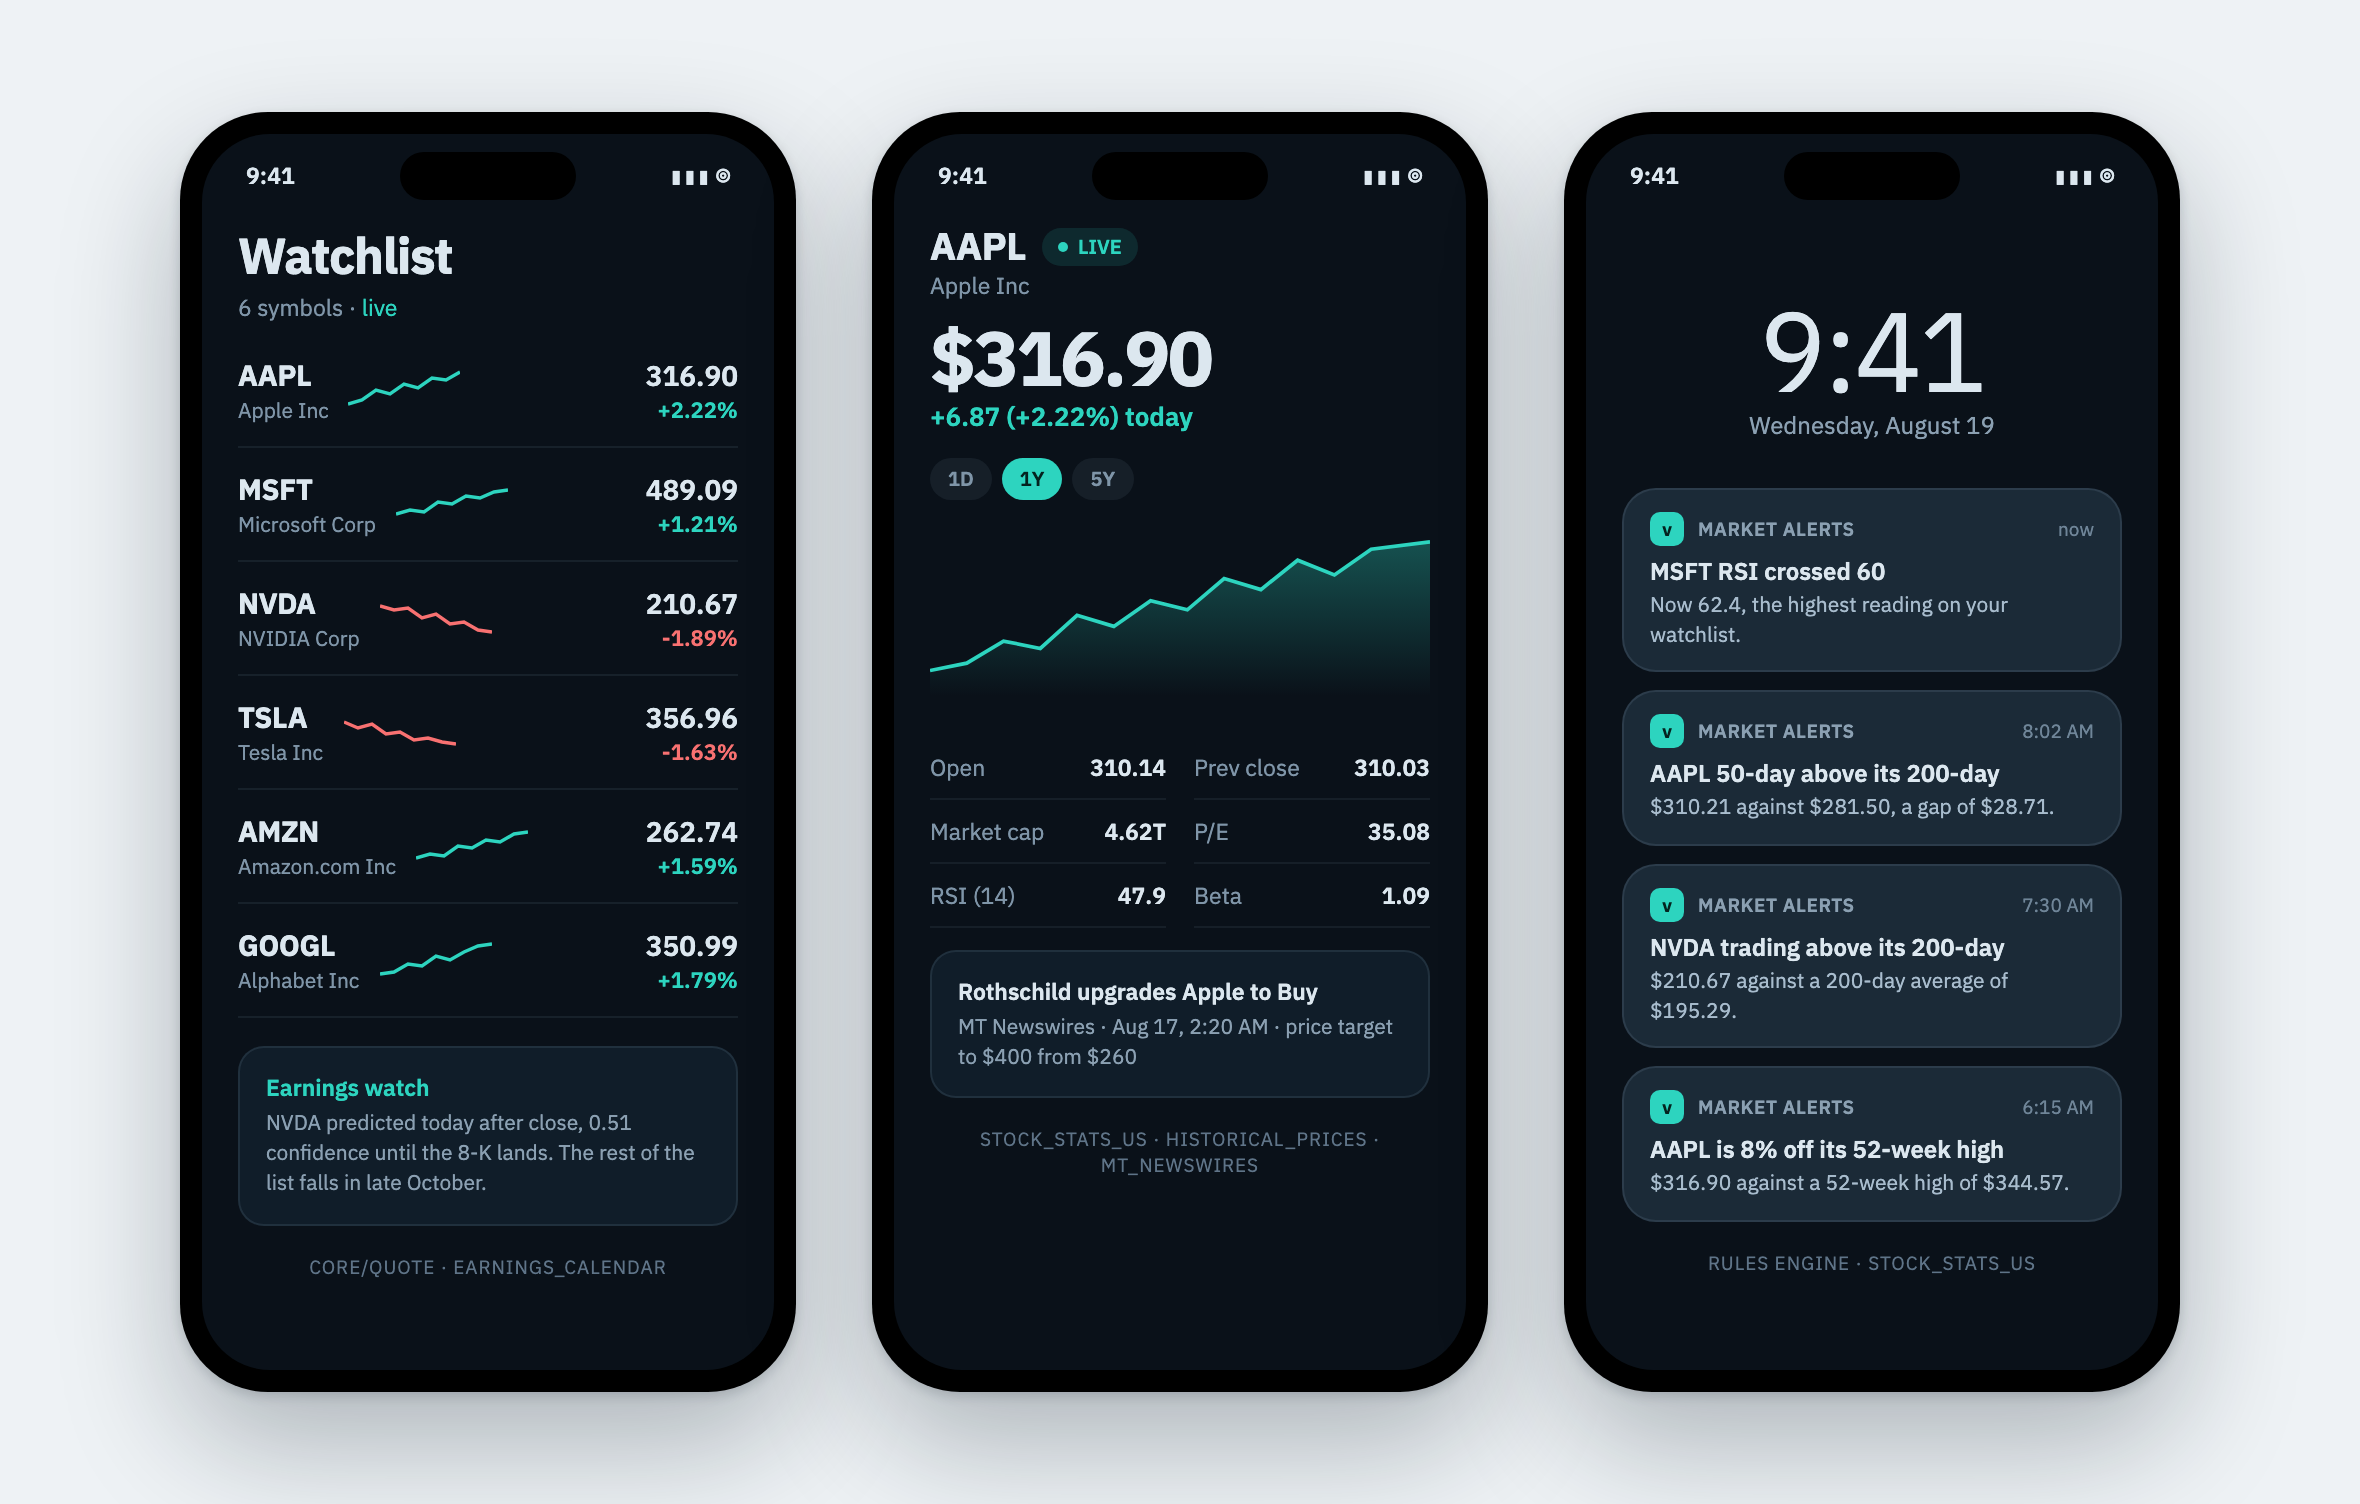
CORE/QUOTE with a list of symbols. The detail view is STOCK_STATS_US and HISTORICAL_PRICES. The alerts are the rules engine on STOCK_STATS_US.Every screen there runs on the datasets already listed in this post. Nothing new was licensed, no second vendor was called, and the key is the same one from the free trial. The path runs docs to connector to working code to a shipped app, and you can walk the whole thing today.
Build One This Afternoon
If your roadmap has a market data surface on it, the question is no longer whether you can build it. It is what you would build if the first working version took fifteen minutes.
Here is the same path Kai took:
- Get a key. Start a free trial.
- Add the connector in Cursor or Claude, then describe the page you want. That is the whole prompt.
- Browse the data catalog to see what else is on the same key.
- Start from working code with our public Claude skills repository, including a live market dashboard skill.
Tell us what you build. We will feature it!