A team decides to build something with market data. A screener, a research tool, an agent that answers questions about a portfolio. They scope it, they get budget, and then they spend the next months not building it.
They spend those months wiring up providers. One vendor for real-time quotes, another for historical bars, a third for fundamentals and corporate actions, a news feed on top. Four contracts, four authentication schemes, four ideas of what a symbol is, four response shapes. Then a normalisation layer to reconcile all of it, which nobody wanted to own and which somebody now owns forever.
By the time that layer works, the thing they actually wanted to make is still a sketch, and the roadmap has slipped a quarter.
We call this the integration tax. It is paid before a single feature ships, it is paid again every time a new dataset is added, and it never appears on the invoice from any of the four vendors.
The tax is not really about plumbing. Underneath it are three specific problems, and every team that assembles market data themselves hits all three.
- Identity — the same instrument has a different name in every feed, so nothing joins cleanly.
- Adjustment — price history lies unless corporate actions are folded into it correctly, and the events that break it are not the obvious ones.
- Reach — whatever you need next is always held by a vendor you have not signed yet.
Here is how each one bites, and what we do about it.
1. Identity is the problem underneath every other problem
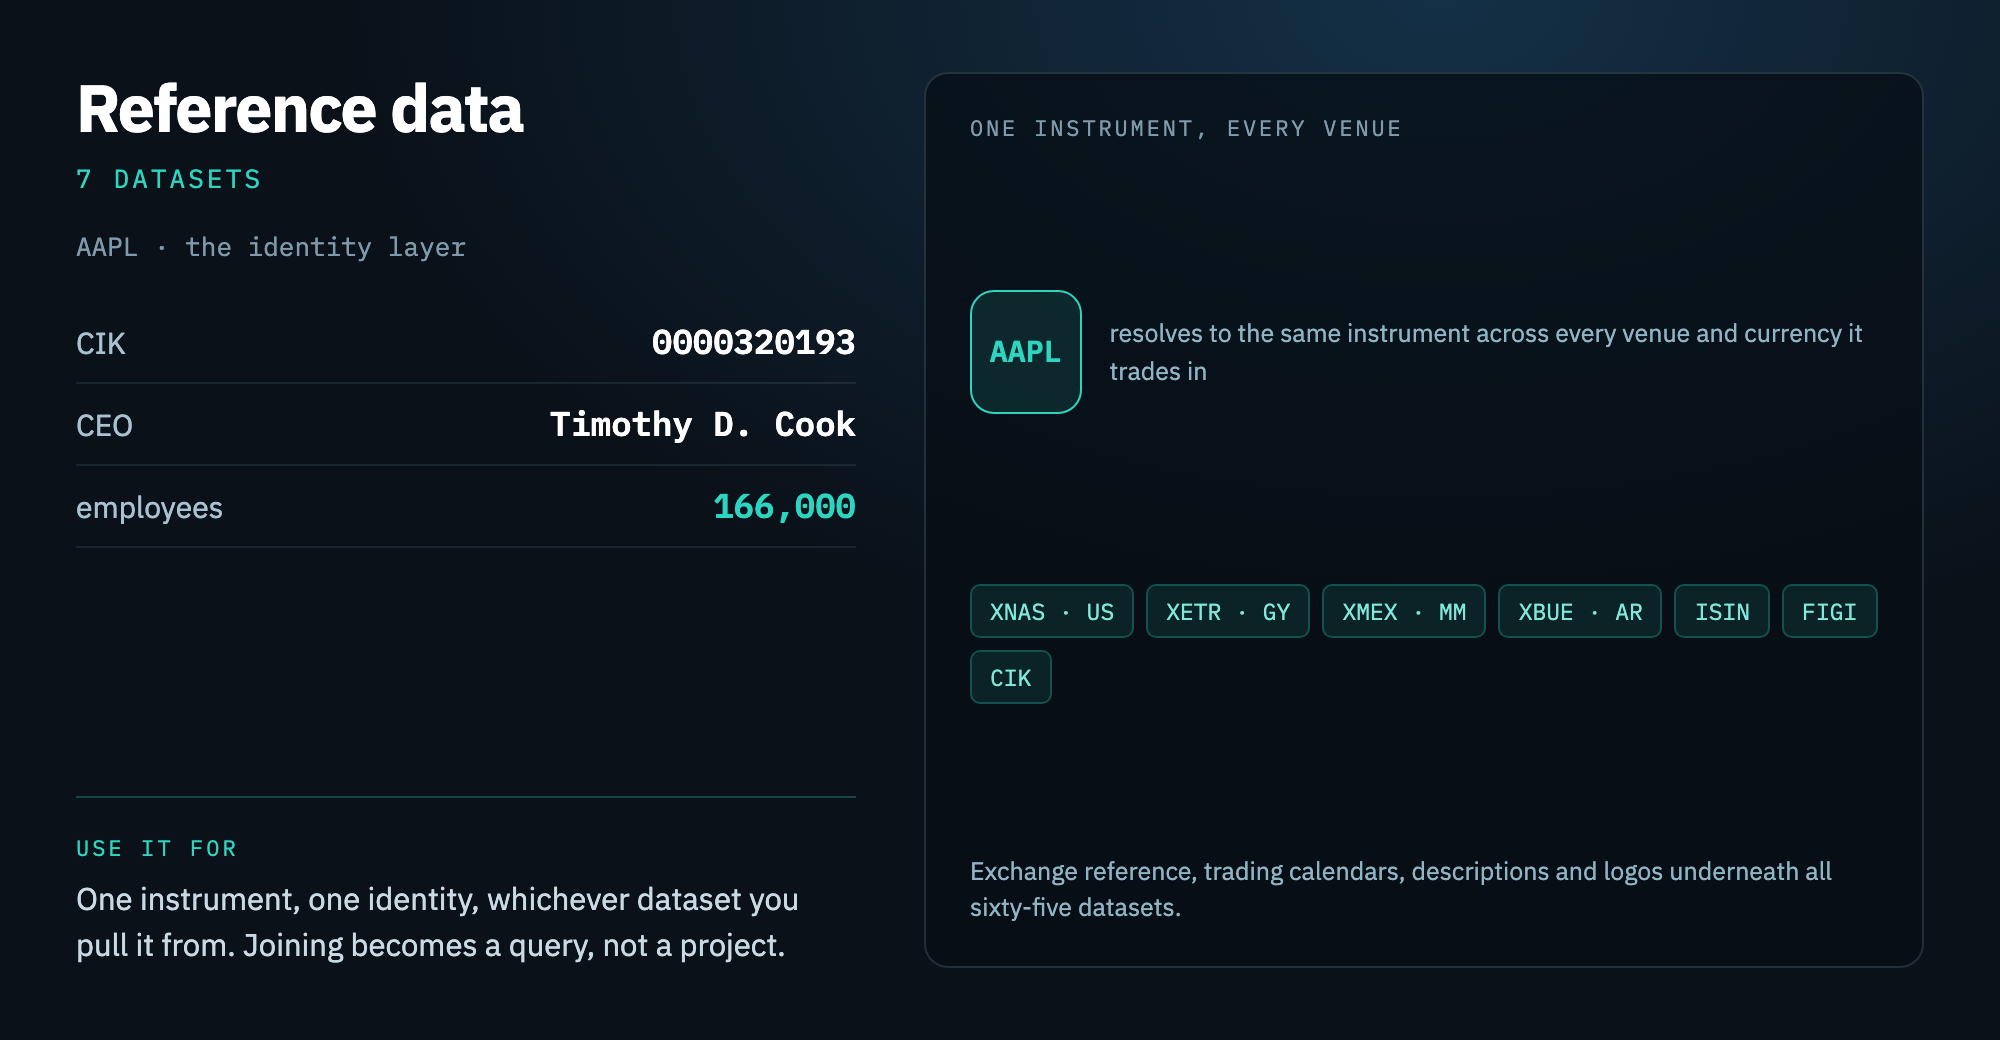
Ask four vendors for Apple and you get four answers. One wants the ticker, one wants an ISIN, one has its own internal id, and the fourth returns a different code depending on which venue the line came from. None of that matters until you try to put a price next to a dividend next to a headline, at which point every join becomes a guess.
This is why teams end up maintaining a symbol master they never intended to build. It is also why bad joins are so hard to catch: nothing errors, the numbers just quietly belong to the wrong company.
Our answer is that the reference layer comes first. Global symbology sits underneath the catalogue and every dataset is mapped onto it on ingest, so they join on the same key. One instrument, one identity, whichever of the sixty-three datasets you pull it from. Exchange reference data, trading calendars, descriptions and logos sit in the same layer.
2. Your price history is probably wrong, and it will not tell you
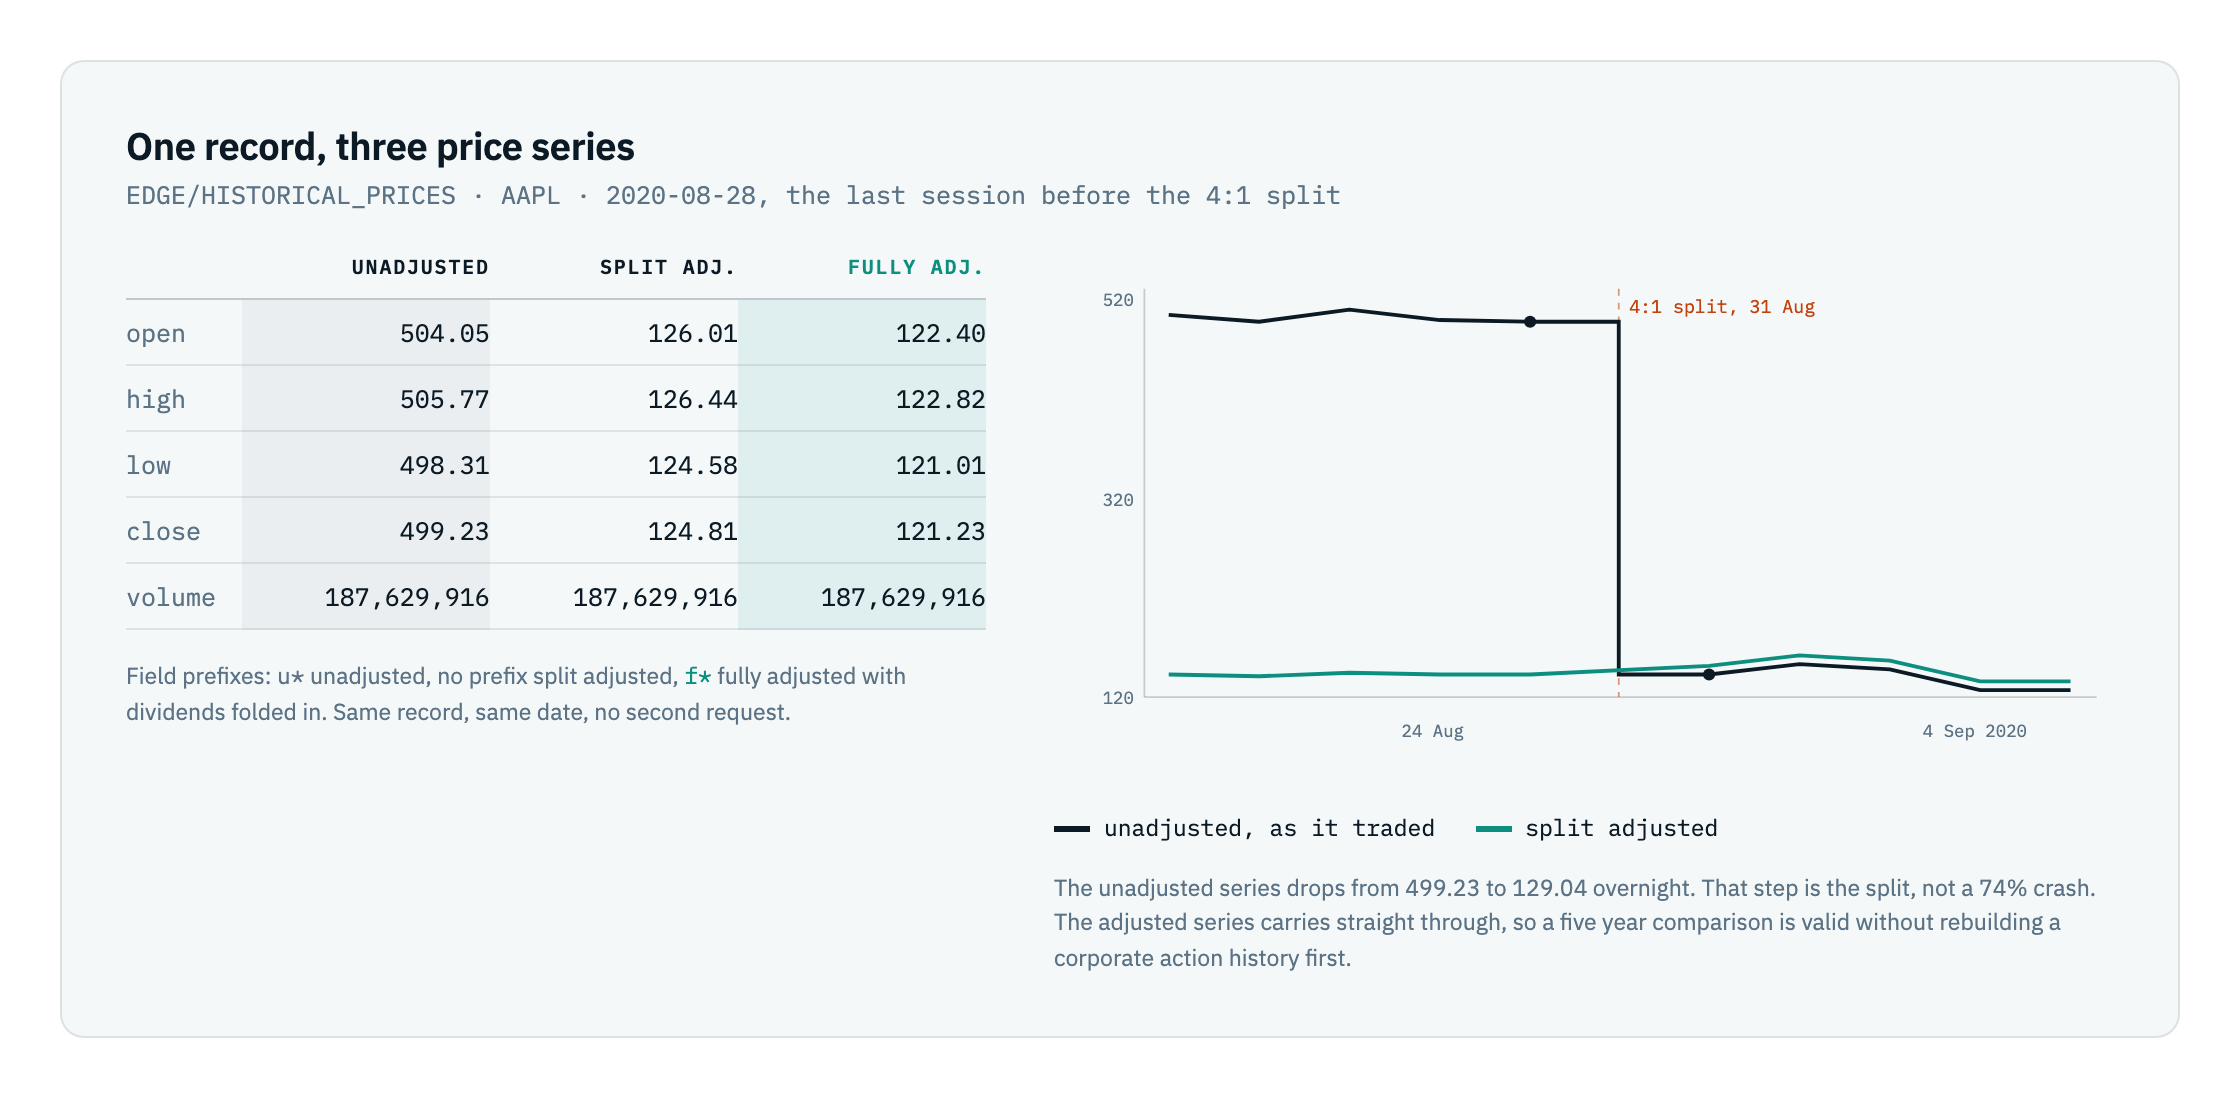
Ask for five years of prices and compare last week to 2021. If the series has not been adjusted for every corporate action in between, the comparison is meaningless, and nothing in the response says so.
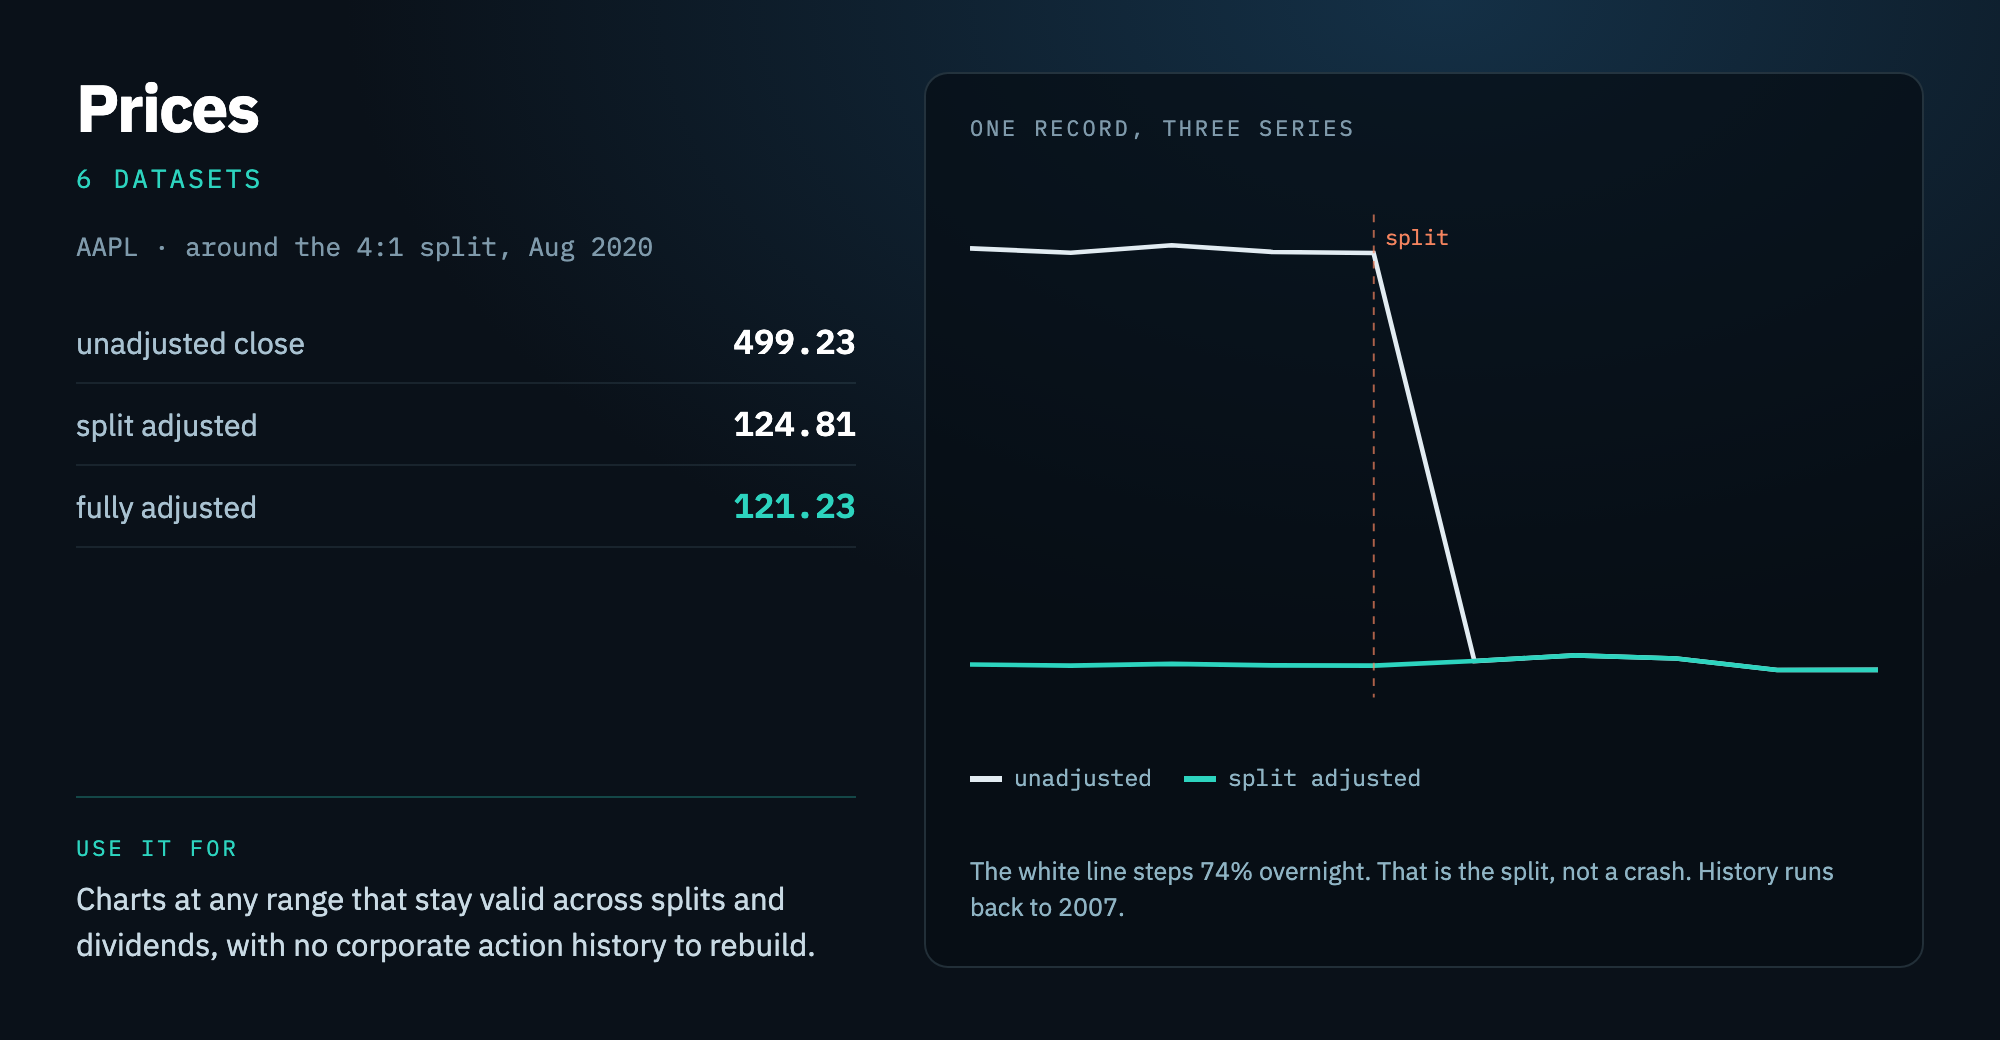
Most feeds hand you one price column and leave the reconstruction to you. Ours carries three on the same record for the same date: the price as it actually traded, the split adjusted series, and the fully adjusted series with dividends folded in.
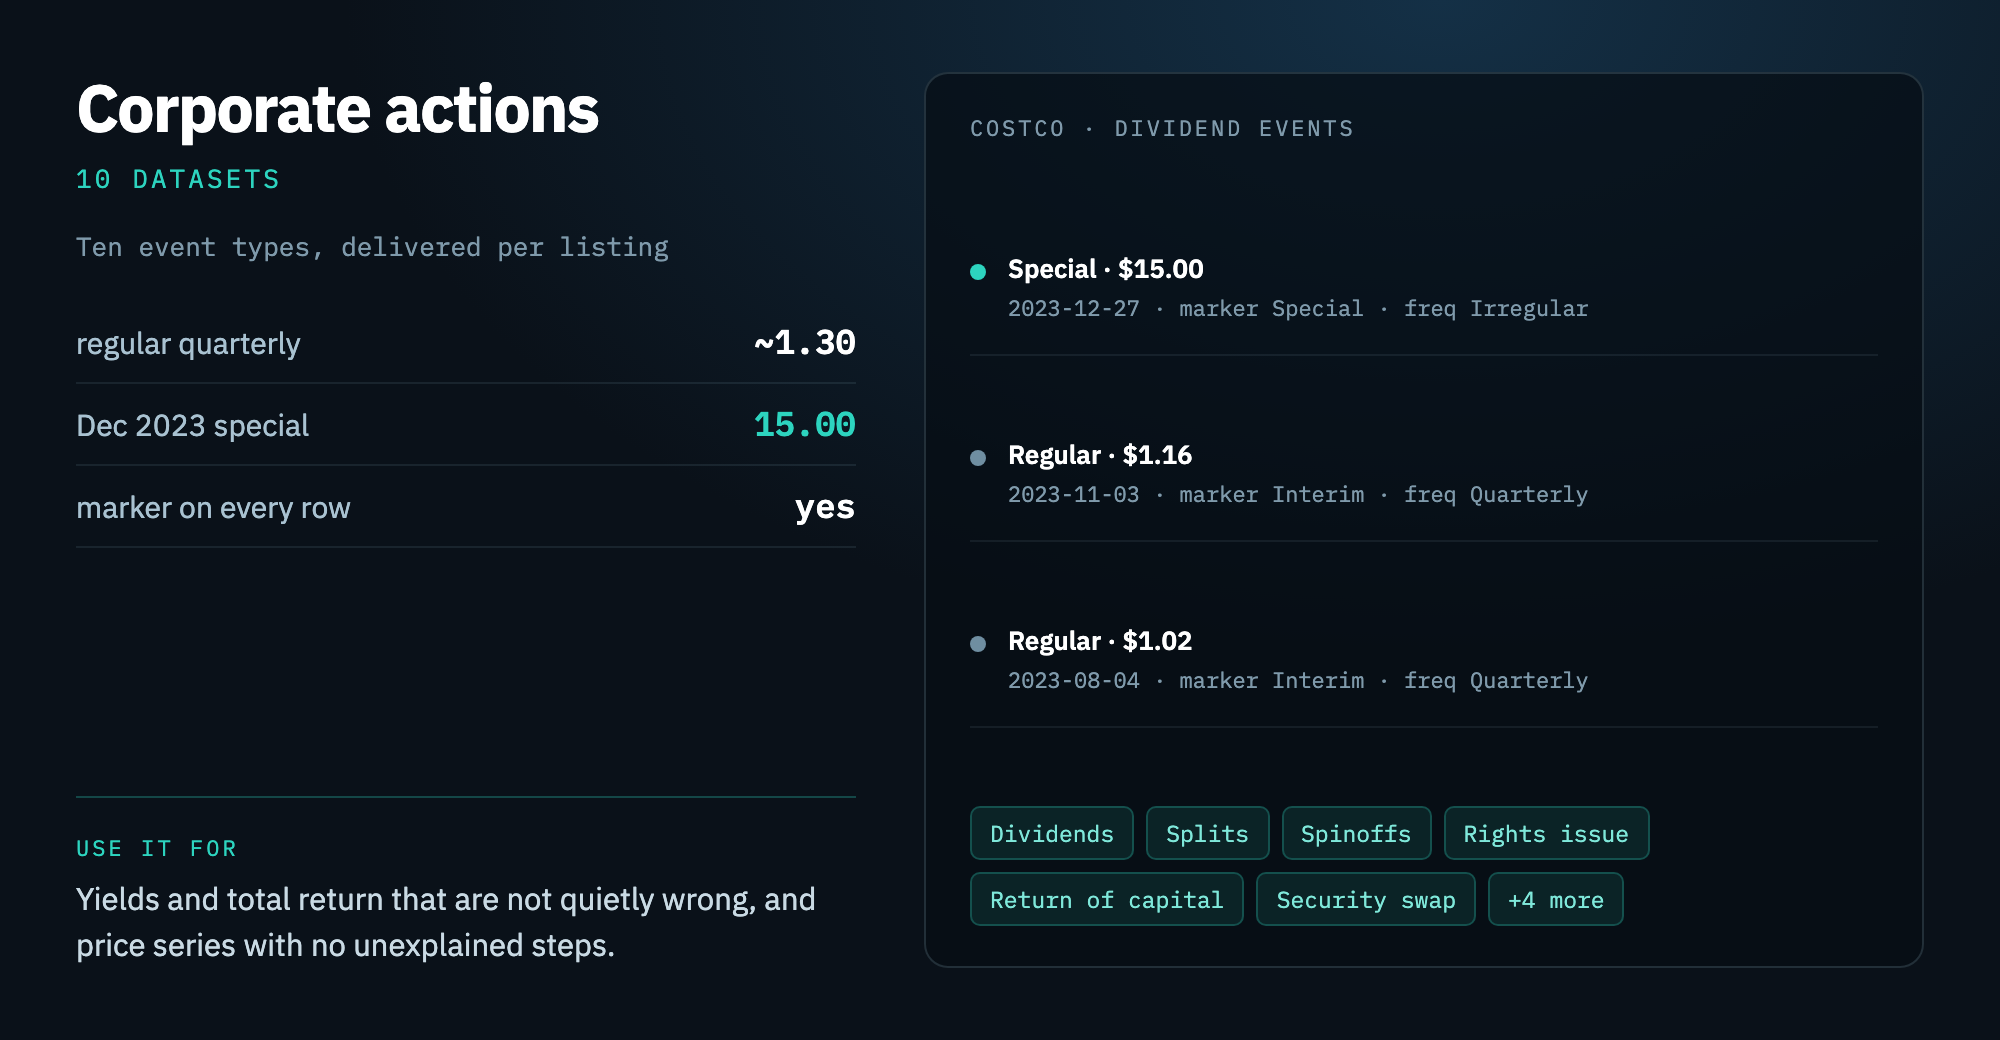
The events that quietly break a series are rarely the plain ones. Most consolidated feeds carry dividends and splits and stop. A spinoff moves a price. So does a return of capital, a rights issue, a security swap. If your data does not carry them, your chart has a step in it that nobody can account for.
Our answer is ten event types rather than two, delivered per listing, so a company trading on a dozen venues gives you the event as it applies to each of them. And because every row carries its status, frequency and marker, separating a recurring dividend from a one-off is a filter rather than a research project. Sum the column naively on Costco and a single $15 special from December 2023 makes your yield nonsense.
3. The dataset you need next is always at another vendor
The third tax is the one that keeps being paid. You ship the screener, and then someone asks whether the move happened in the closing auction. Or what the street expects next quarter. Or what the market thinks the odds are. Each answer is a new vendor, a new contract, and the first two problems all over again.
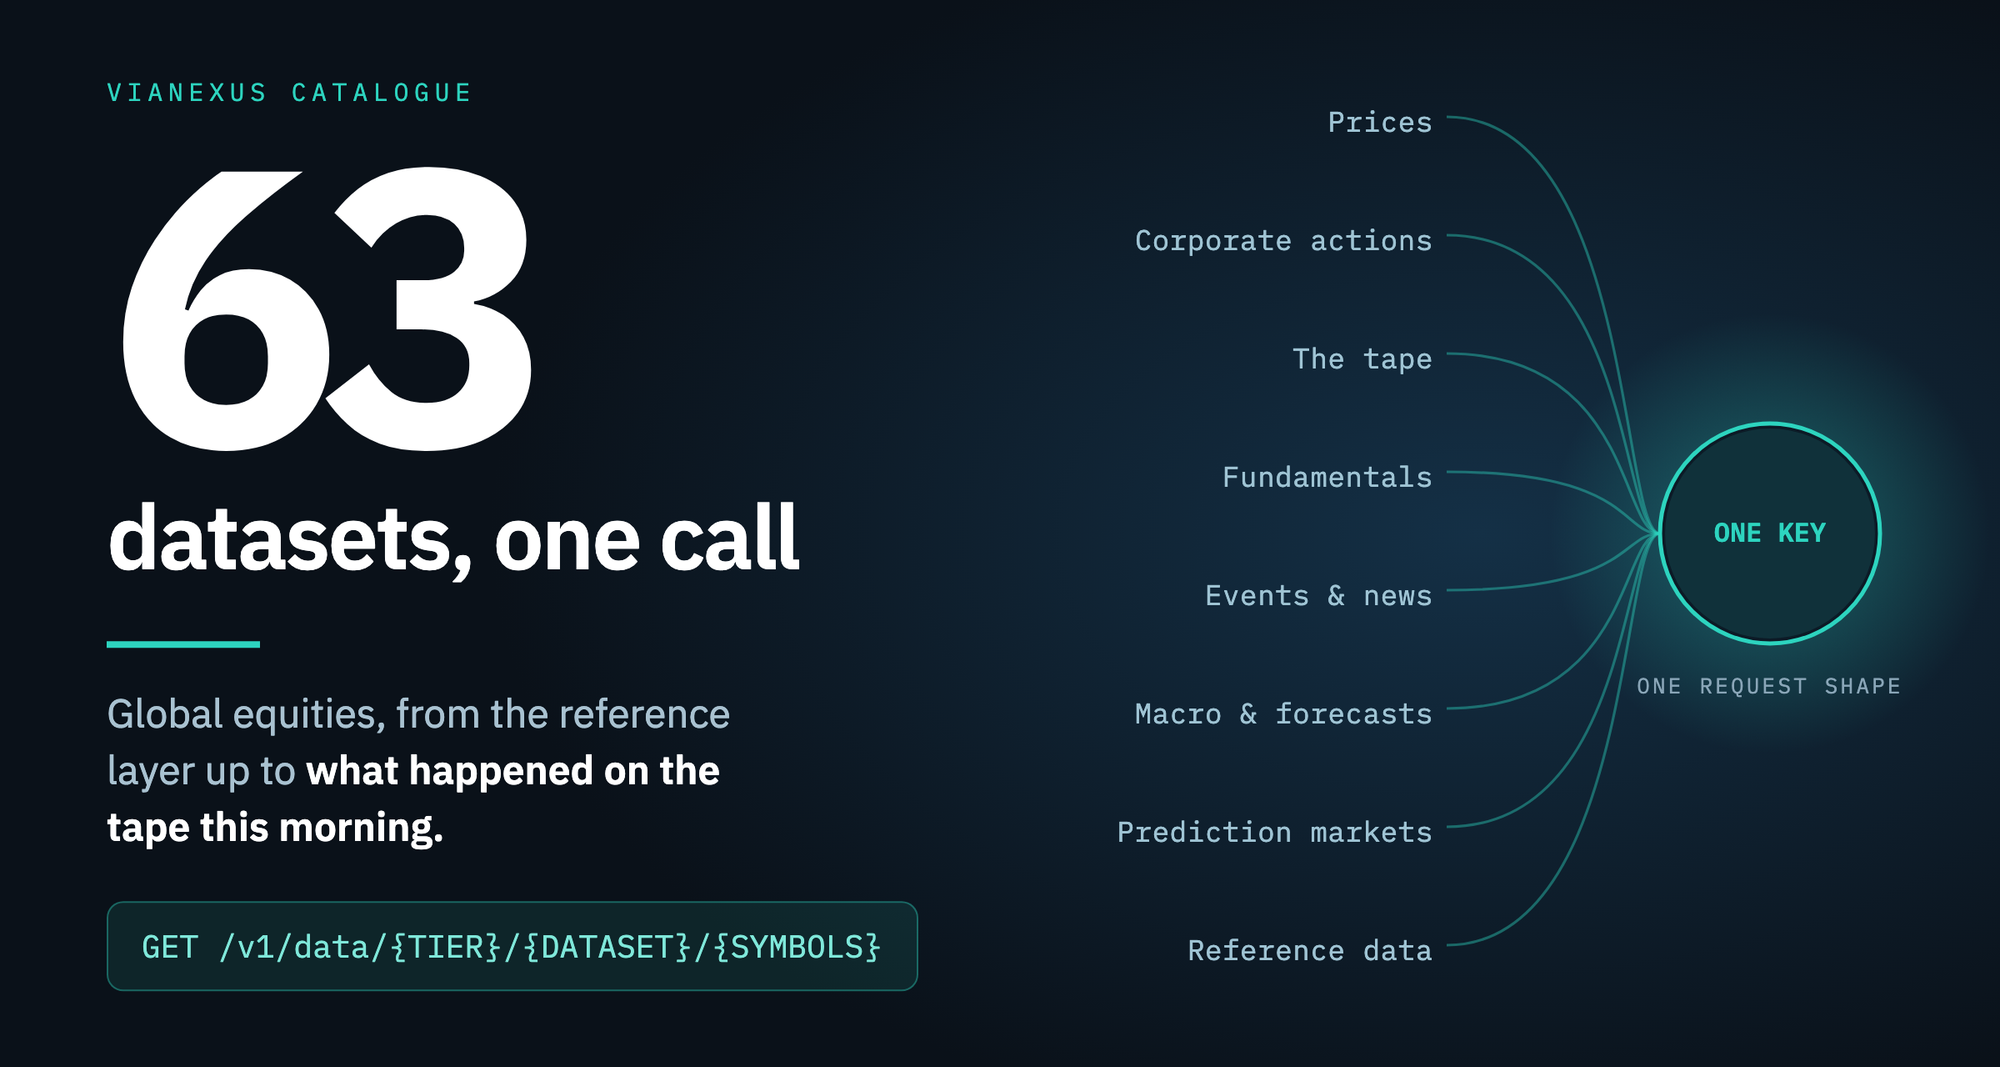
Our answer is reach on the same key. Sixty-three datasets across eight groups, from the reference layer up to what happened on the tape this morning, all answering the same shape of request. Adding one to something you have already built is a dataset name, not an integration.
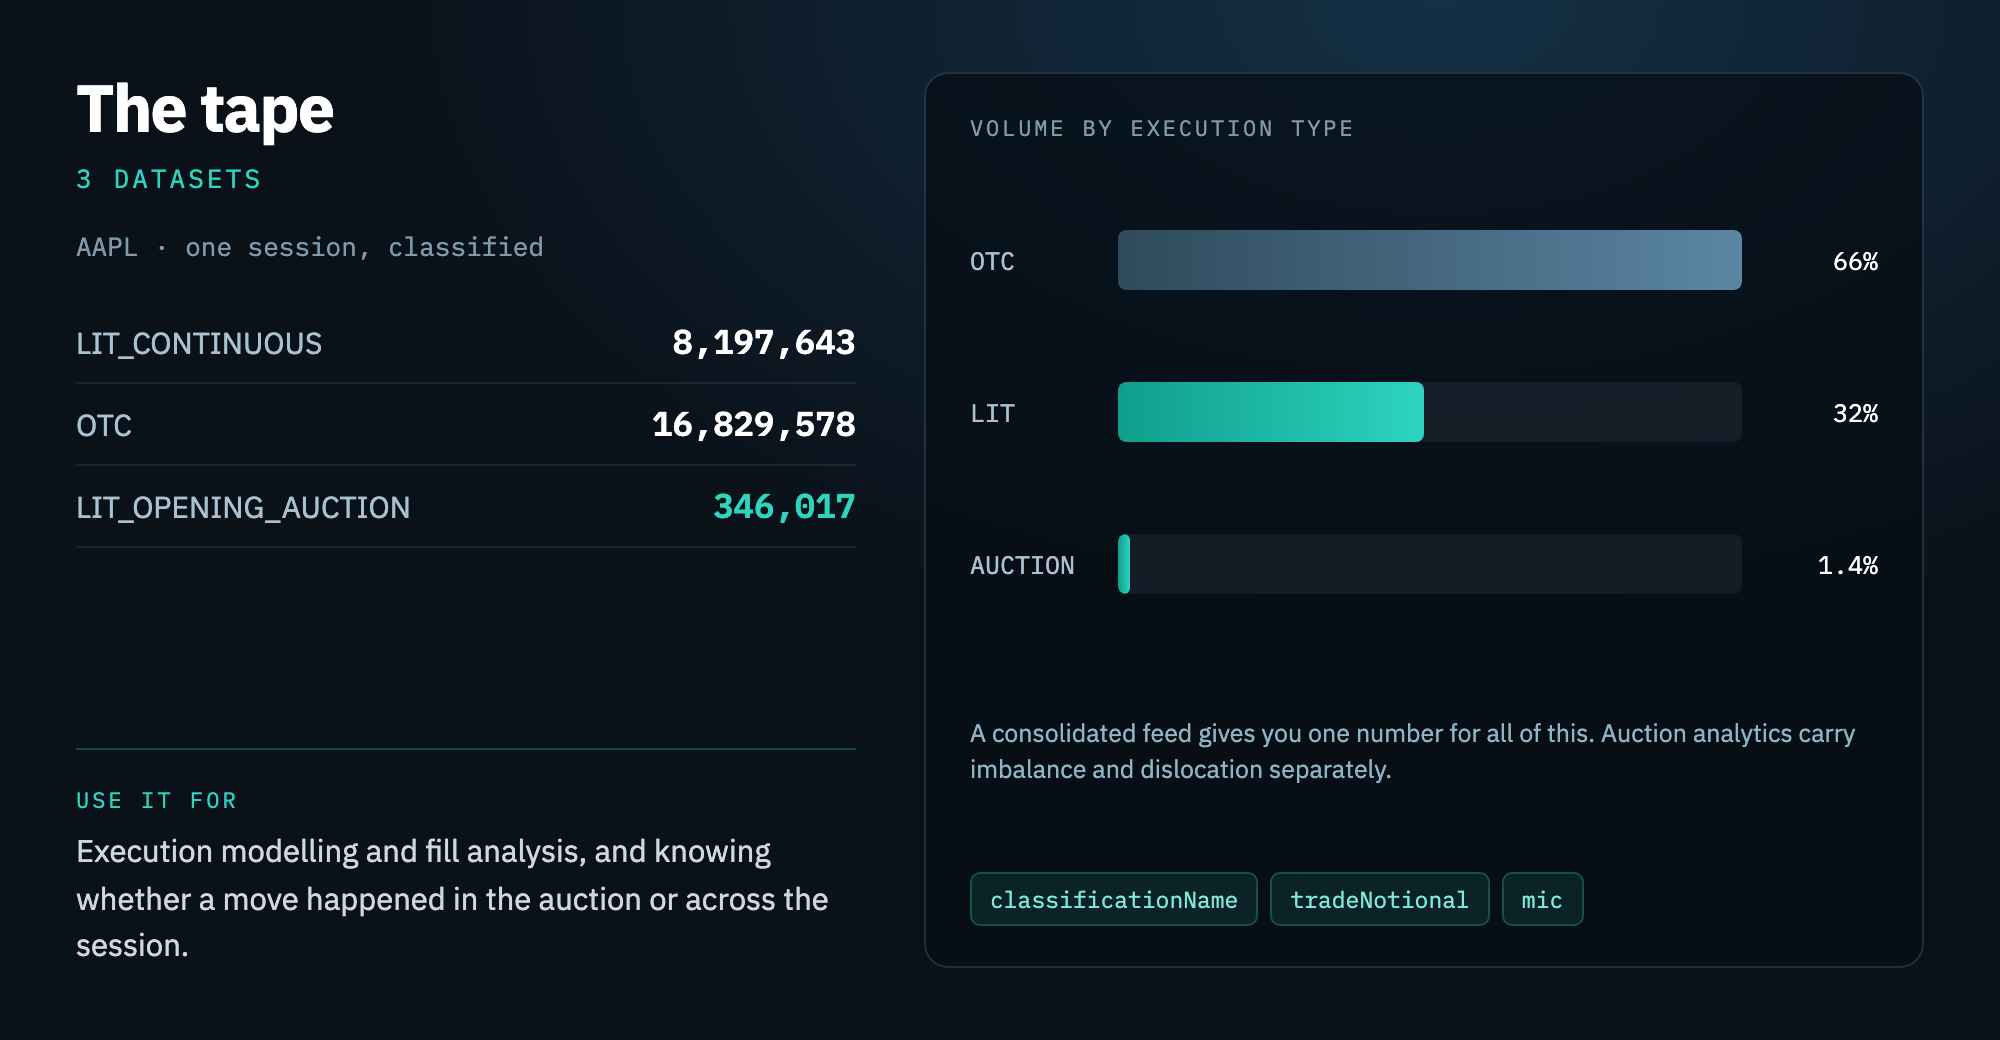
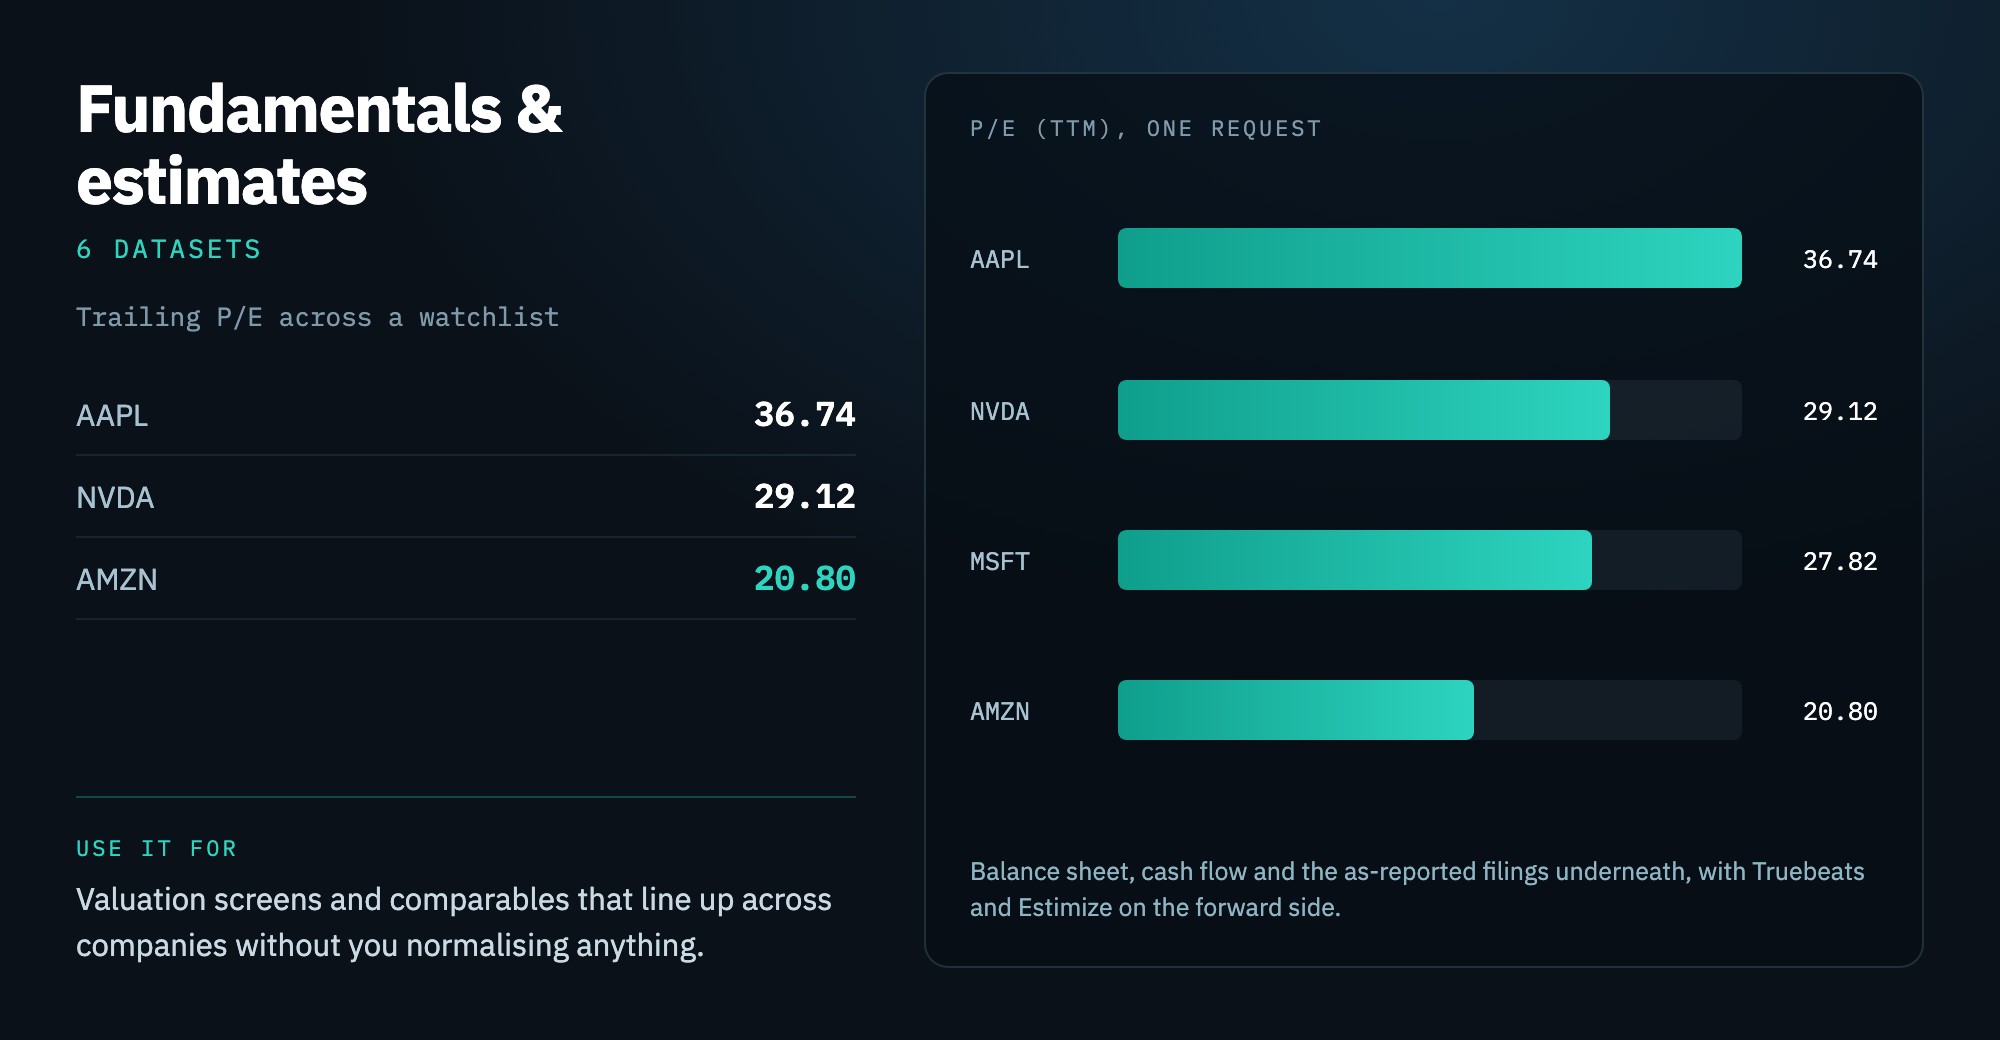
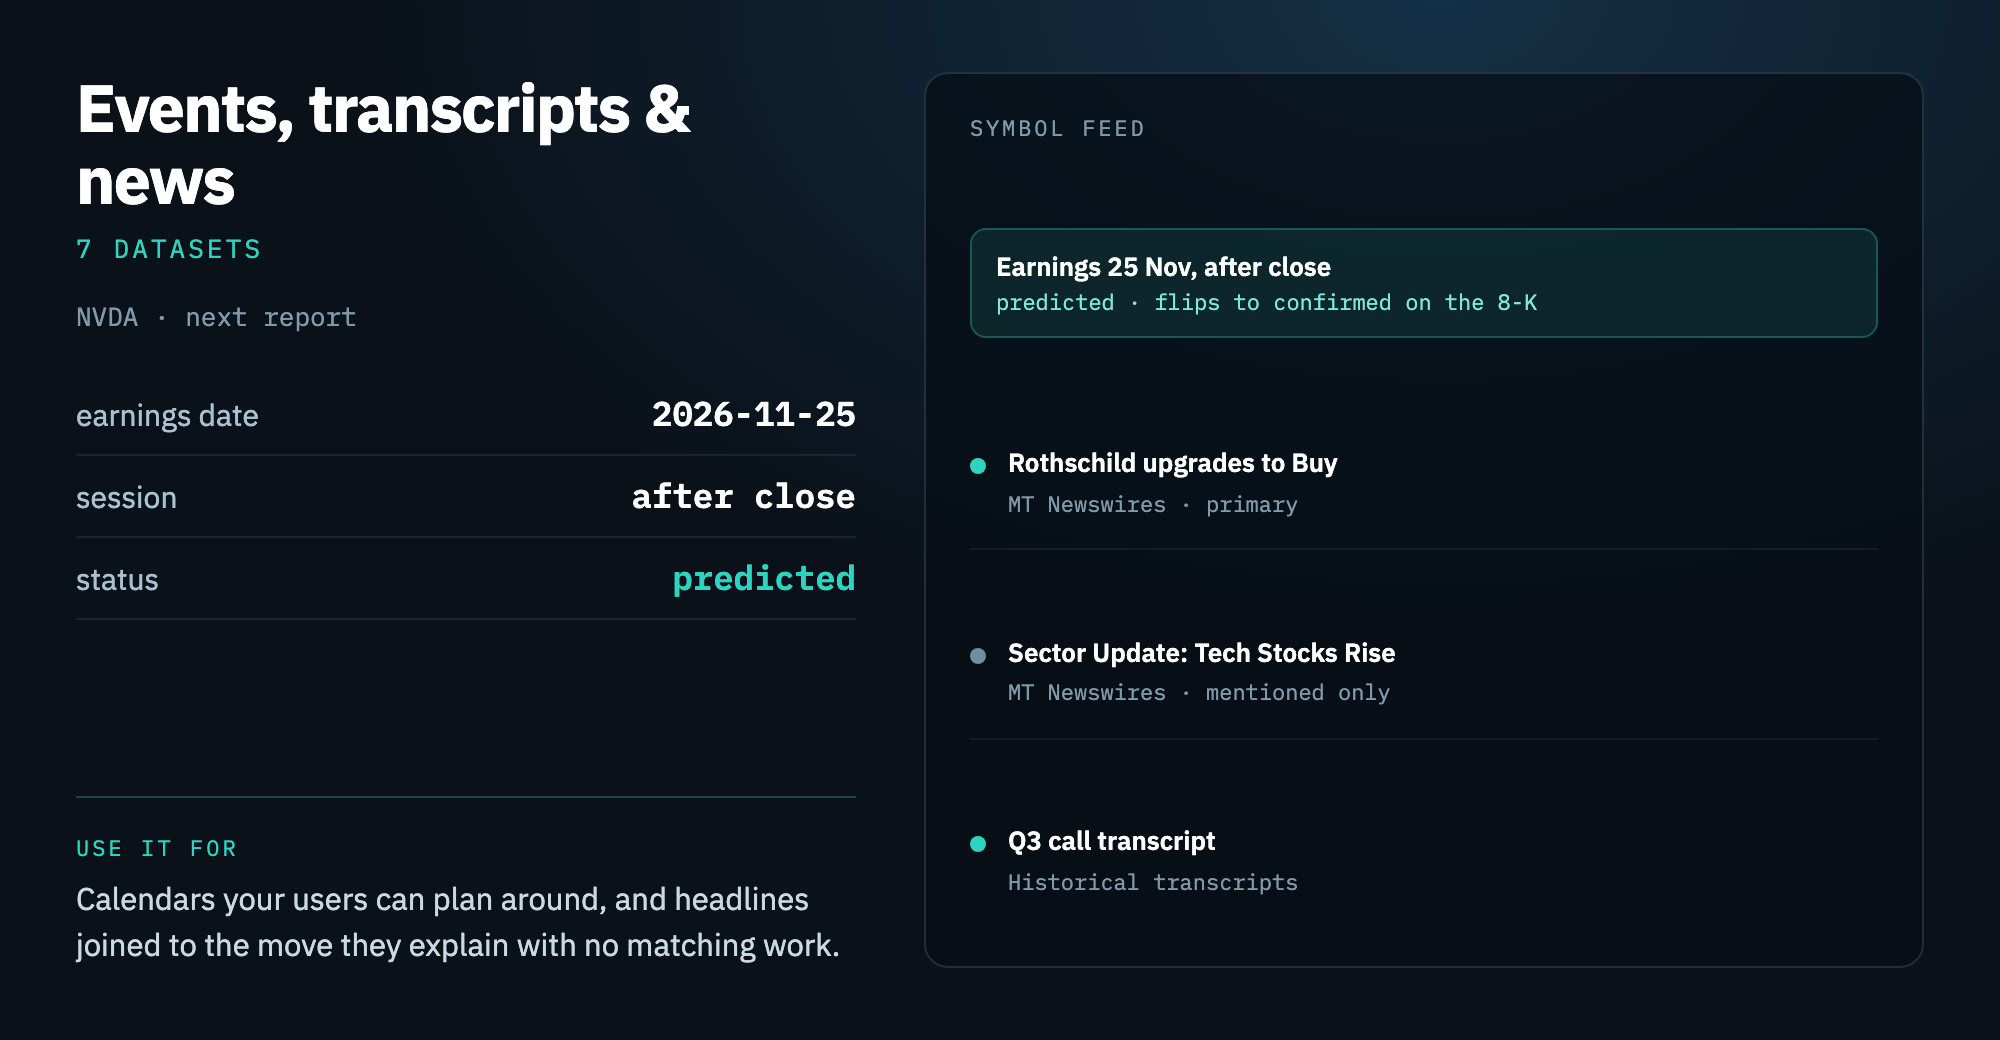
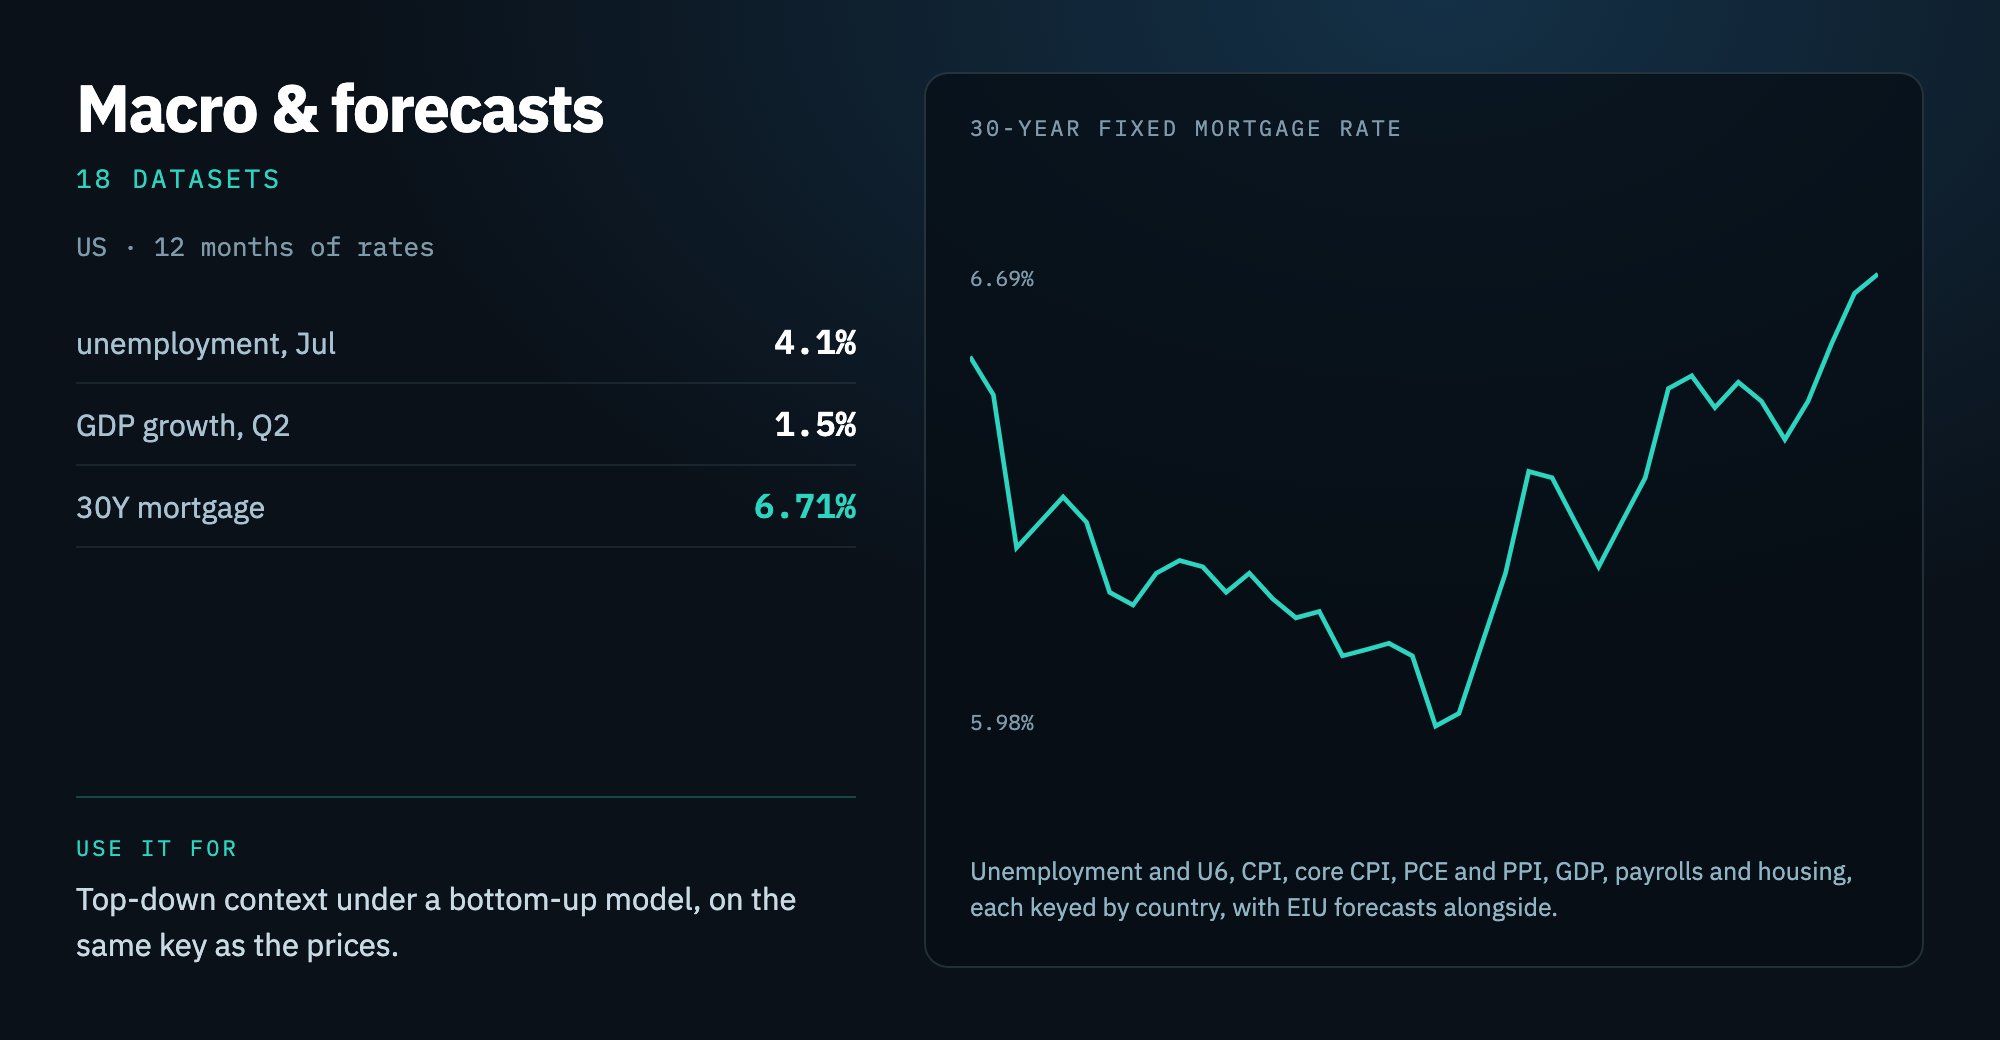
Each card below shows a real record from one group and what people do with it. Scroll sideways.
← scroll for all eight →
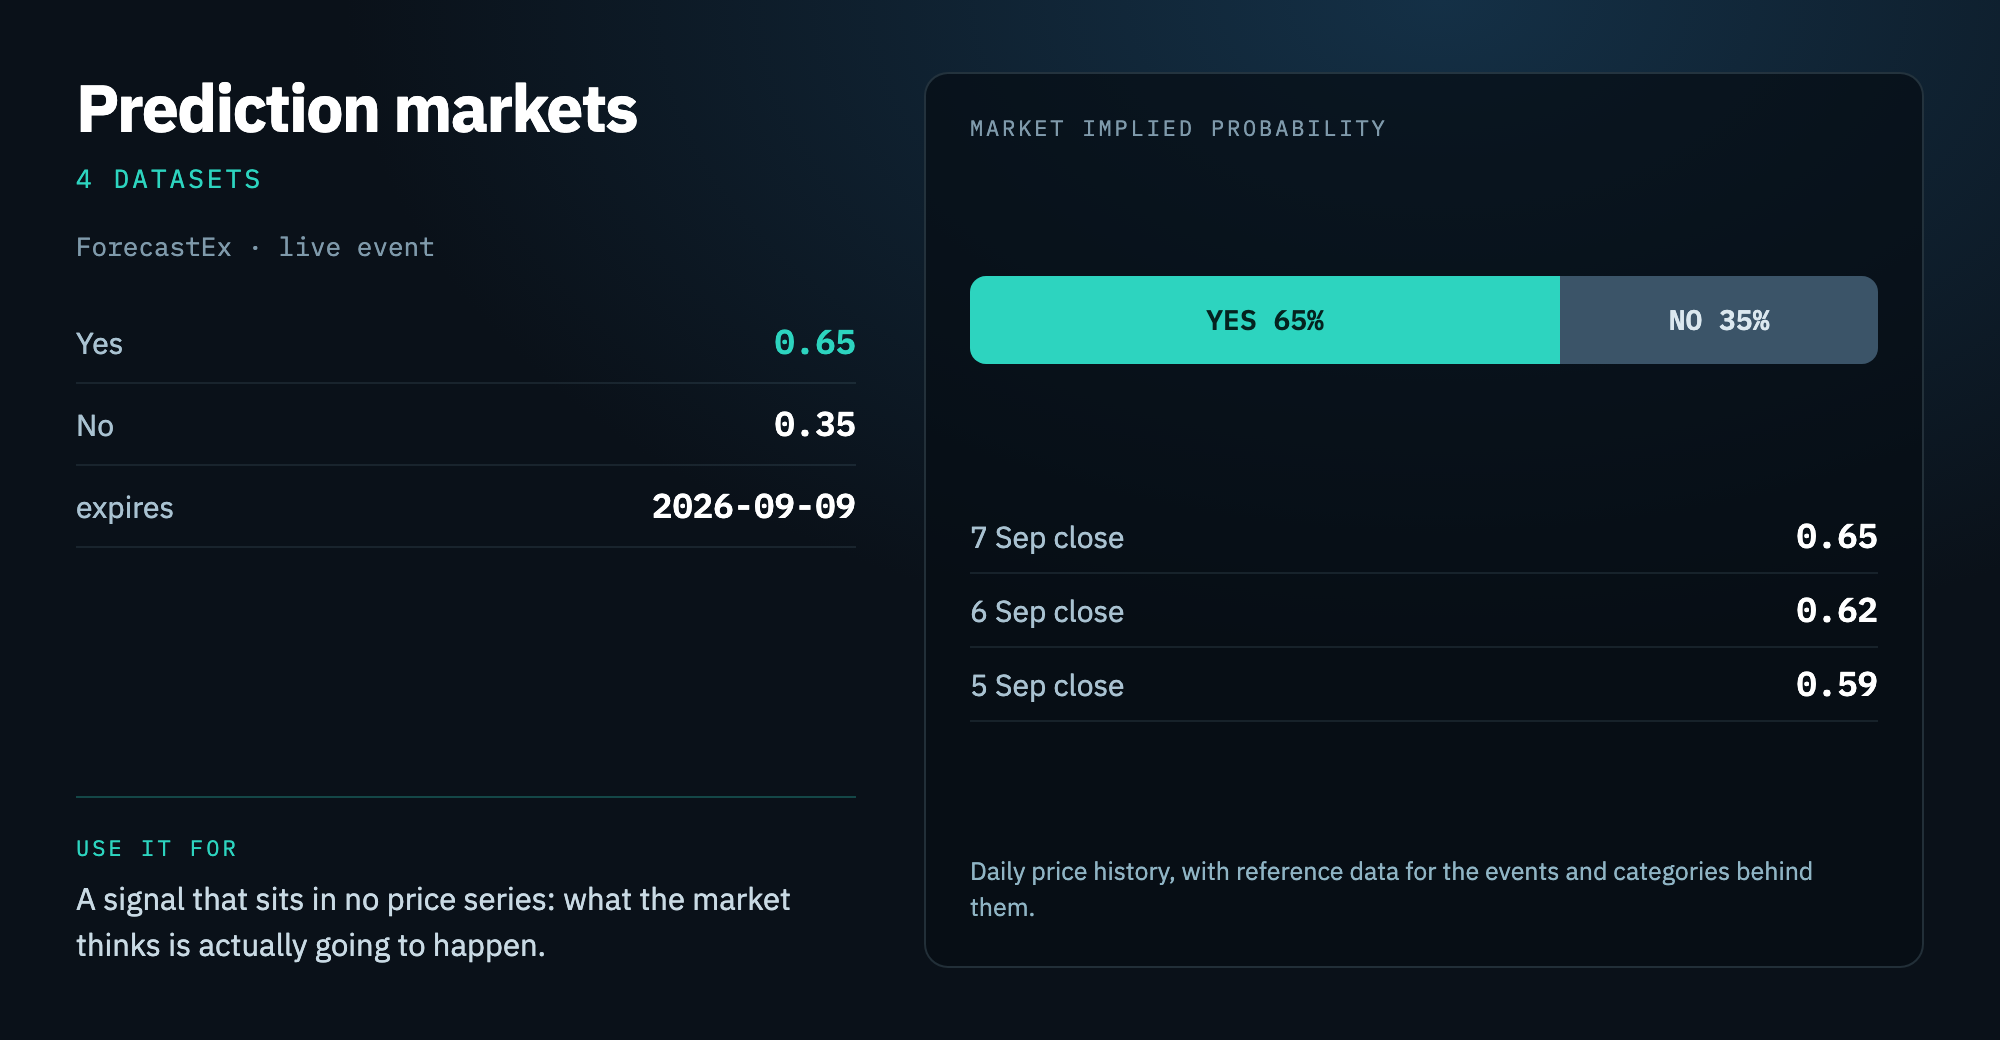
Two of those are worth pausing on, because few consolidators carry them at all. The tape classifies every trade by how it executed, so continuous trading, the auctions, off book and dark activity are separable instead of collapsed into one volume figure. If you are modelling execution or measuring your own fills, that is the difference between an estimate and a number. And prediction markets are a signal that exists in no price series: market implied probabilities on events, with daily history and reference data behind them.
What you build once the tax is gone
Take those three problems away and the work changes shape. The quarter you were going to spend on a normalisation layer goes into the product instead.
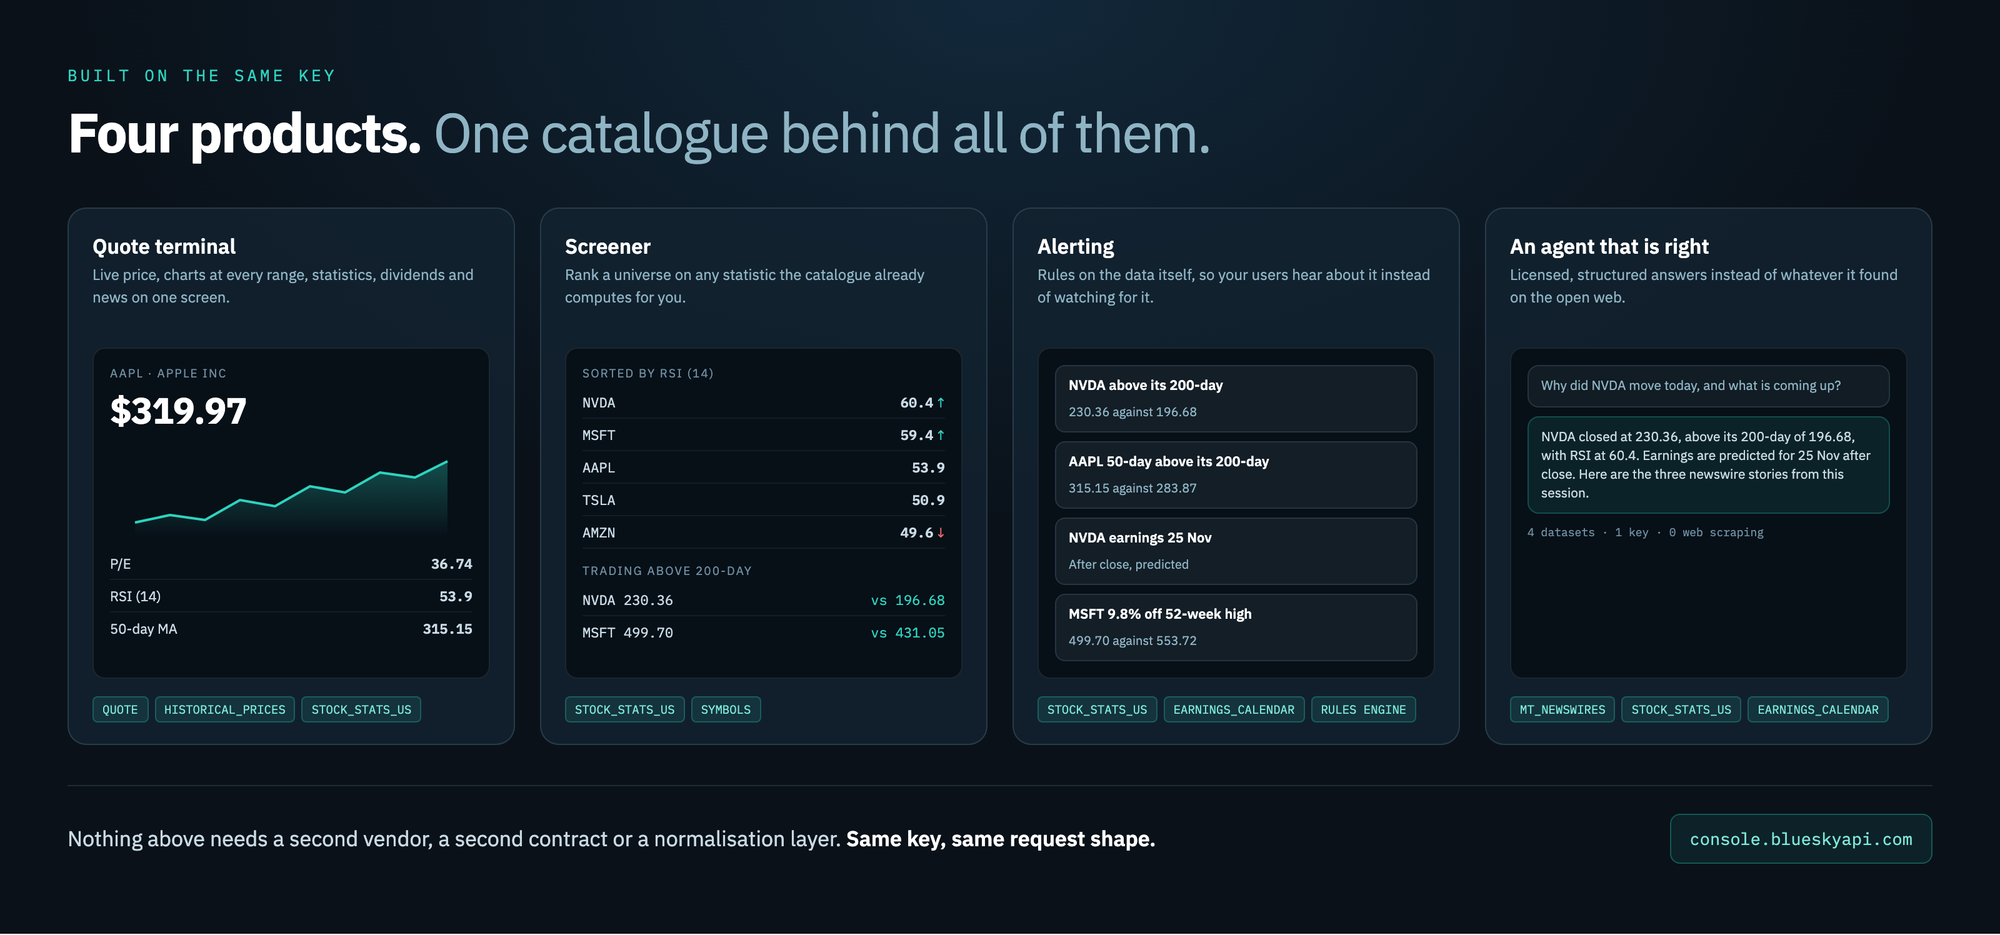
None of those needed a second vendor, a second contract, or a reconciliation step. The screener is the terminal with a list of symbols instead of one. The alerting product is the screener with a rule on top. The agent is all of it, reachable by something that reasons, answering from licensed data rather than whatever it found on the open web.
Getting at it
Every dataset answers the same shape of request. Pick the tier, pick the dataset, pass your symbols and a date range, and get JSON back, with the same authentication throughout.
GET /v1/data/{TIER}/{DATASET}/{SYMBOLS}?from=&to=The consistency is deliberate. It means a person exploring in a browser and an agent working through the catalogue meet the same predictable surface, and it is why adding the next dataset is usually a one line change.
It also means you do not have to write the calls yourself. Our connector is available in Cursor and in Claude, so the assistant you already work in can query all sixty-three datasets while it writes your code. That is a real difference in practice: it is not reading documentation about our API and guessing, it is calling it, checking live responses and real field names as it builds. Wrong guesses get caught before they reach your file.
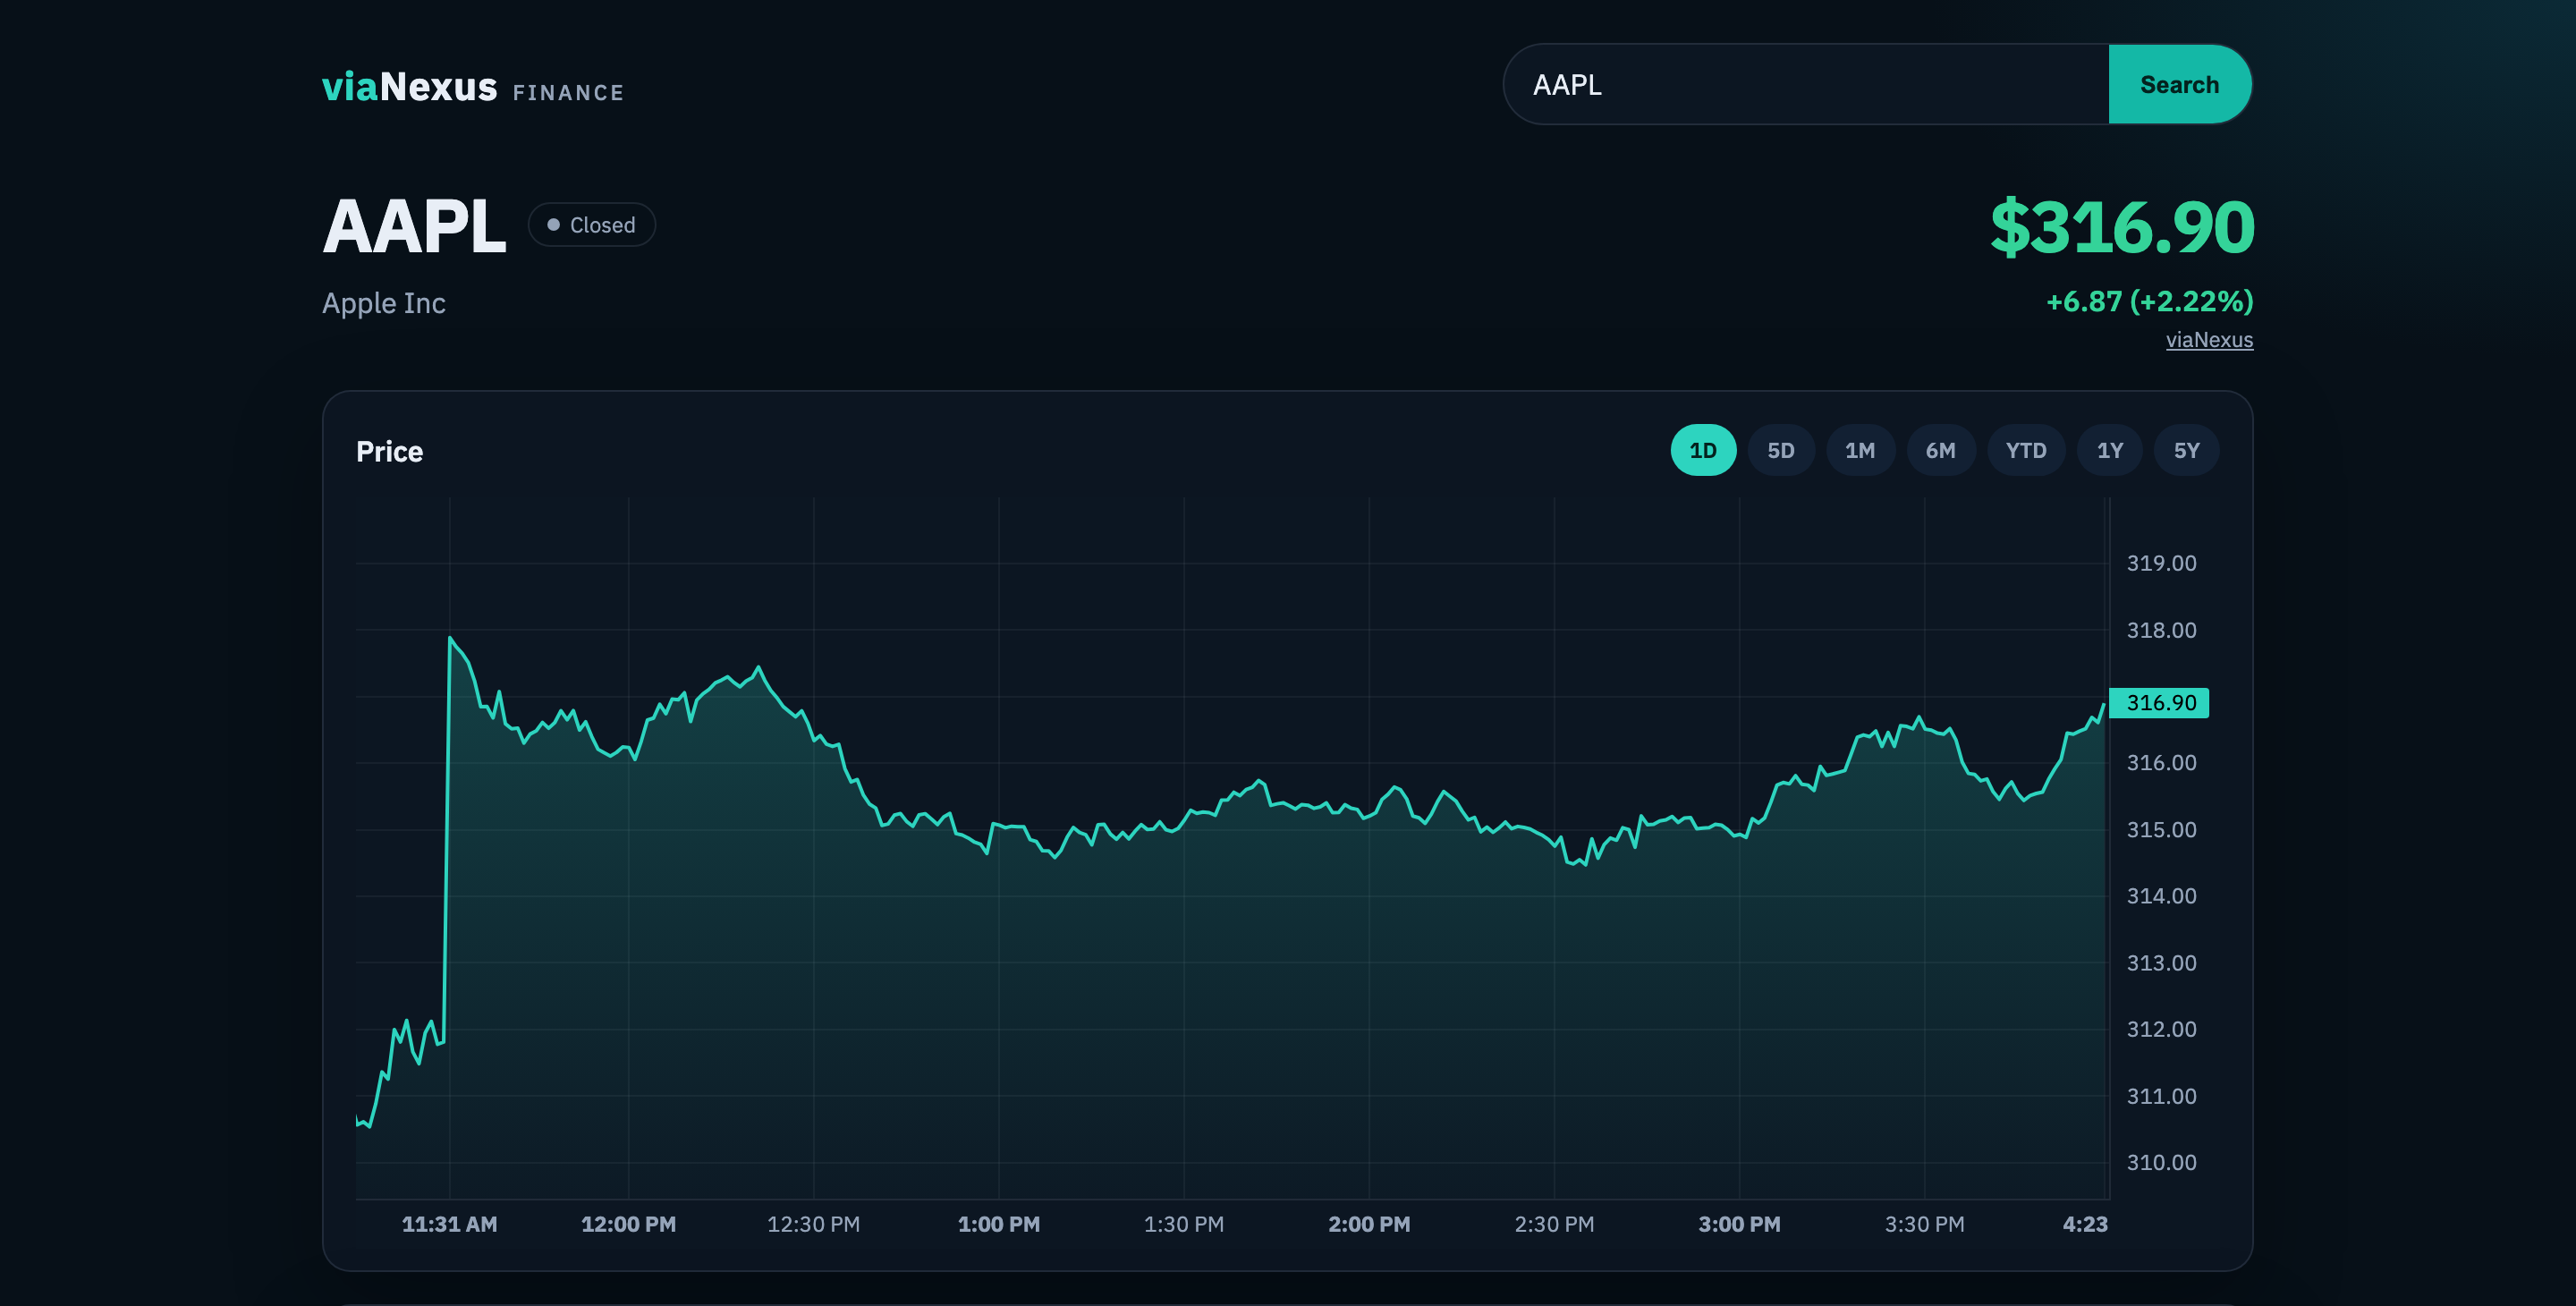
One of our developers used exactly that to build a full stock quote page, live prices and all, in fifteen minutes.
Start a free trial, add the connector in Cursor or Claude, and describe what you want to build. The integration tax is already paid.